Tables to help you navigate Imatest modules and charts
Imatest is a complex, rich application involving a great many image quality factors, modules, and test charts. The tables below, for Quality Factor, Module, and Test chart are designed to help navigate the site. A Table of contents is also available.
Suppliers
Most test charts are available from the Imatest Store.
| Supplier | Chart(s) and comments | Location |
| Imatest | A large variety of charts (sharpness, color, tone, dynamic range) may be ordered from the Imatest store. | Boulder, CO USA |
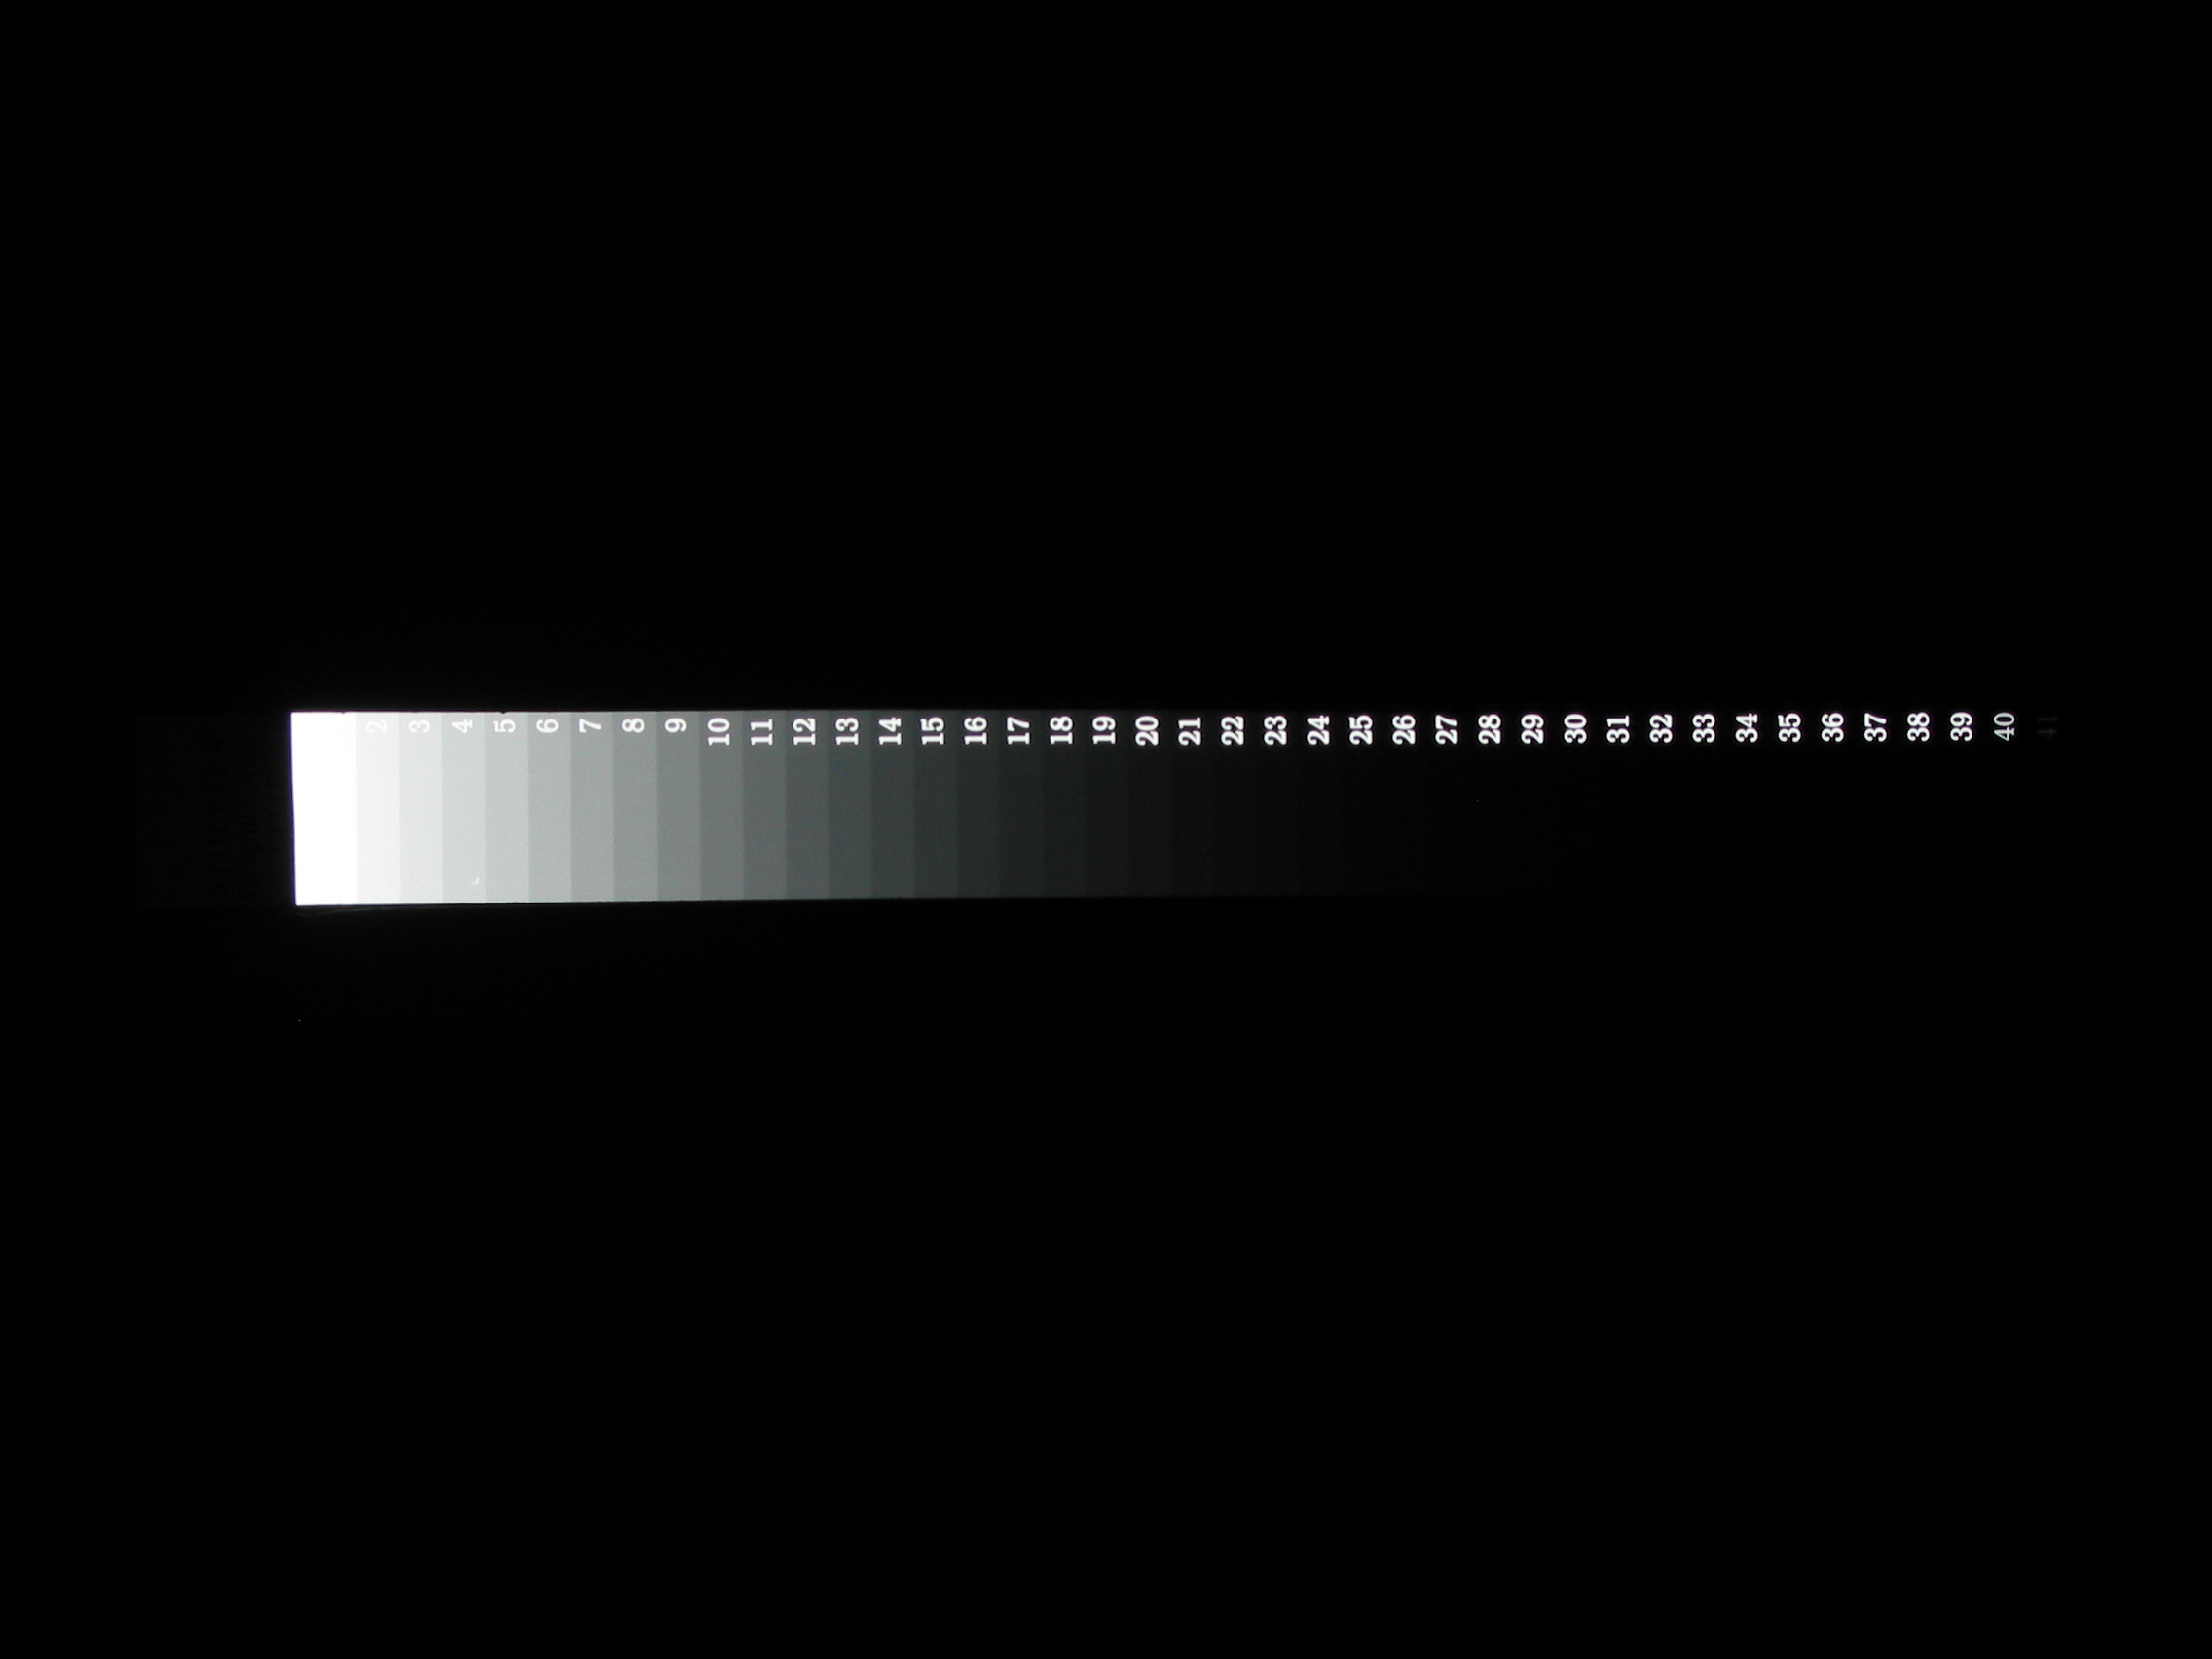
| Stouffer | The Stouffer T4110 transmission step wedge was recommended for single-image Dynamic Range measurements prior to the development of the Imatest 36-patch Dynamic Range chart. (Reflective step charts can be used for DR measurement from several images.) | Chicago, IL USA |
| Wolf Faust (Coloraid.de) |
IT8.7 (standard color target with reference file, printed on photographic paper). Used in Multicharts. Available in the US from Digital Light and Color. | Frankfurt, Germany |
Image quality factors
Image quality factors have their own page. A brief list of recommended test charts is given in the FAQ.
| Quality factor | Charts | Module | Comments |
|
Camera, lens
|
|||
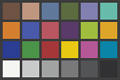
| Color accuracy | X-Rite ColorChecker (24-patch) | Colorcheck, Multicharts | |
| IT8.7 | Multicharts | ||
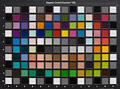
| ColorChecker SG | Multicharts | Imatest Master only | |
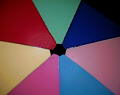
| Custom “pie” charts | Multicharts | Imatest Master only | |
| Dynamic range, Tonal response, Contrast | Step charts | Stepchart | Transmissive charts such as the Imatest 36-patch Dynamic Range chart or the Stouffer T4110. |
| Reflective step charts | Dynamic Range | More convenient for measuring DR than Stepchart because it doesn’t require a transmission chart. (But manual exposure control is required.) | |
| Special charts: ISO-16067-1, QA-62, ISO-14524 OECF, ISO-15739 Noise, 20-patch OECF charts | Stepchart | Imatest Master only. | |
| ColorChecker, ColorChecker SG, IT8.7, Step Charts | Multicharts | ||
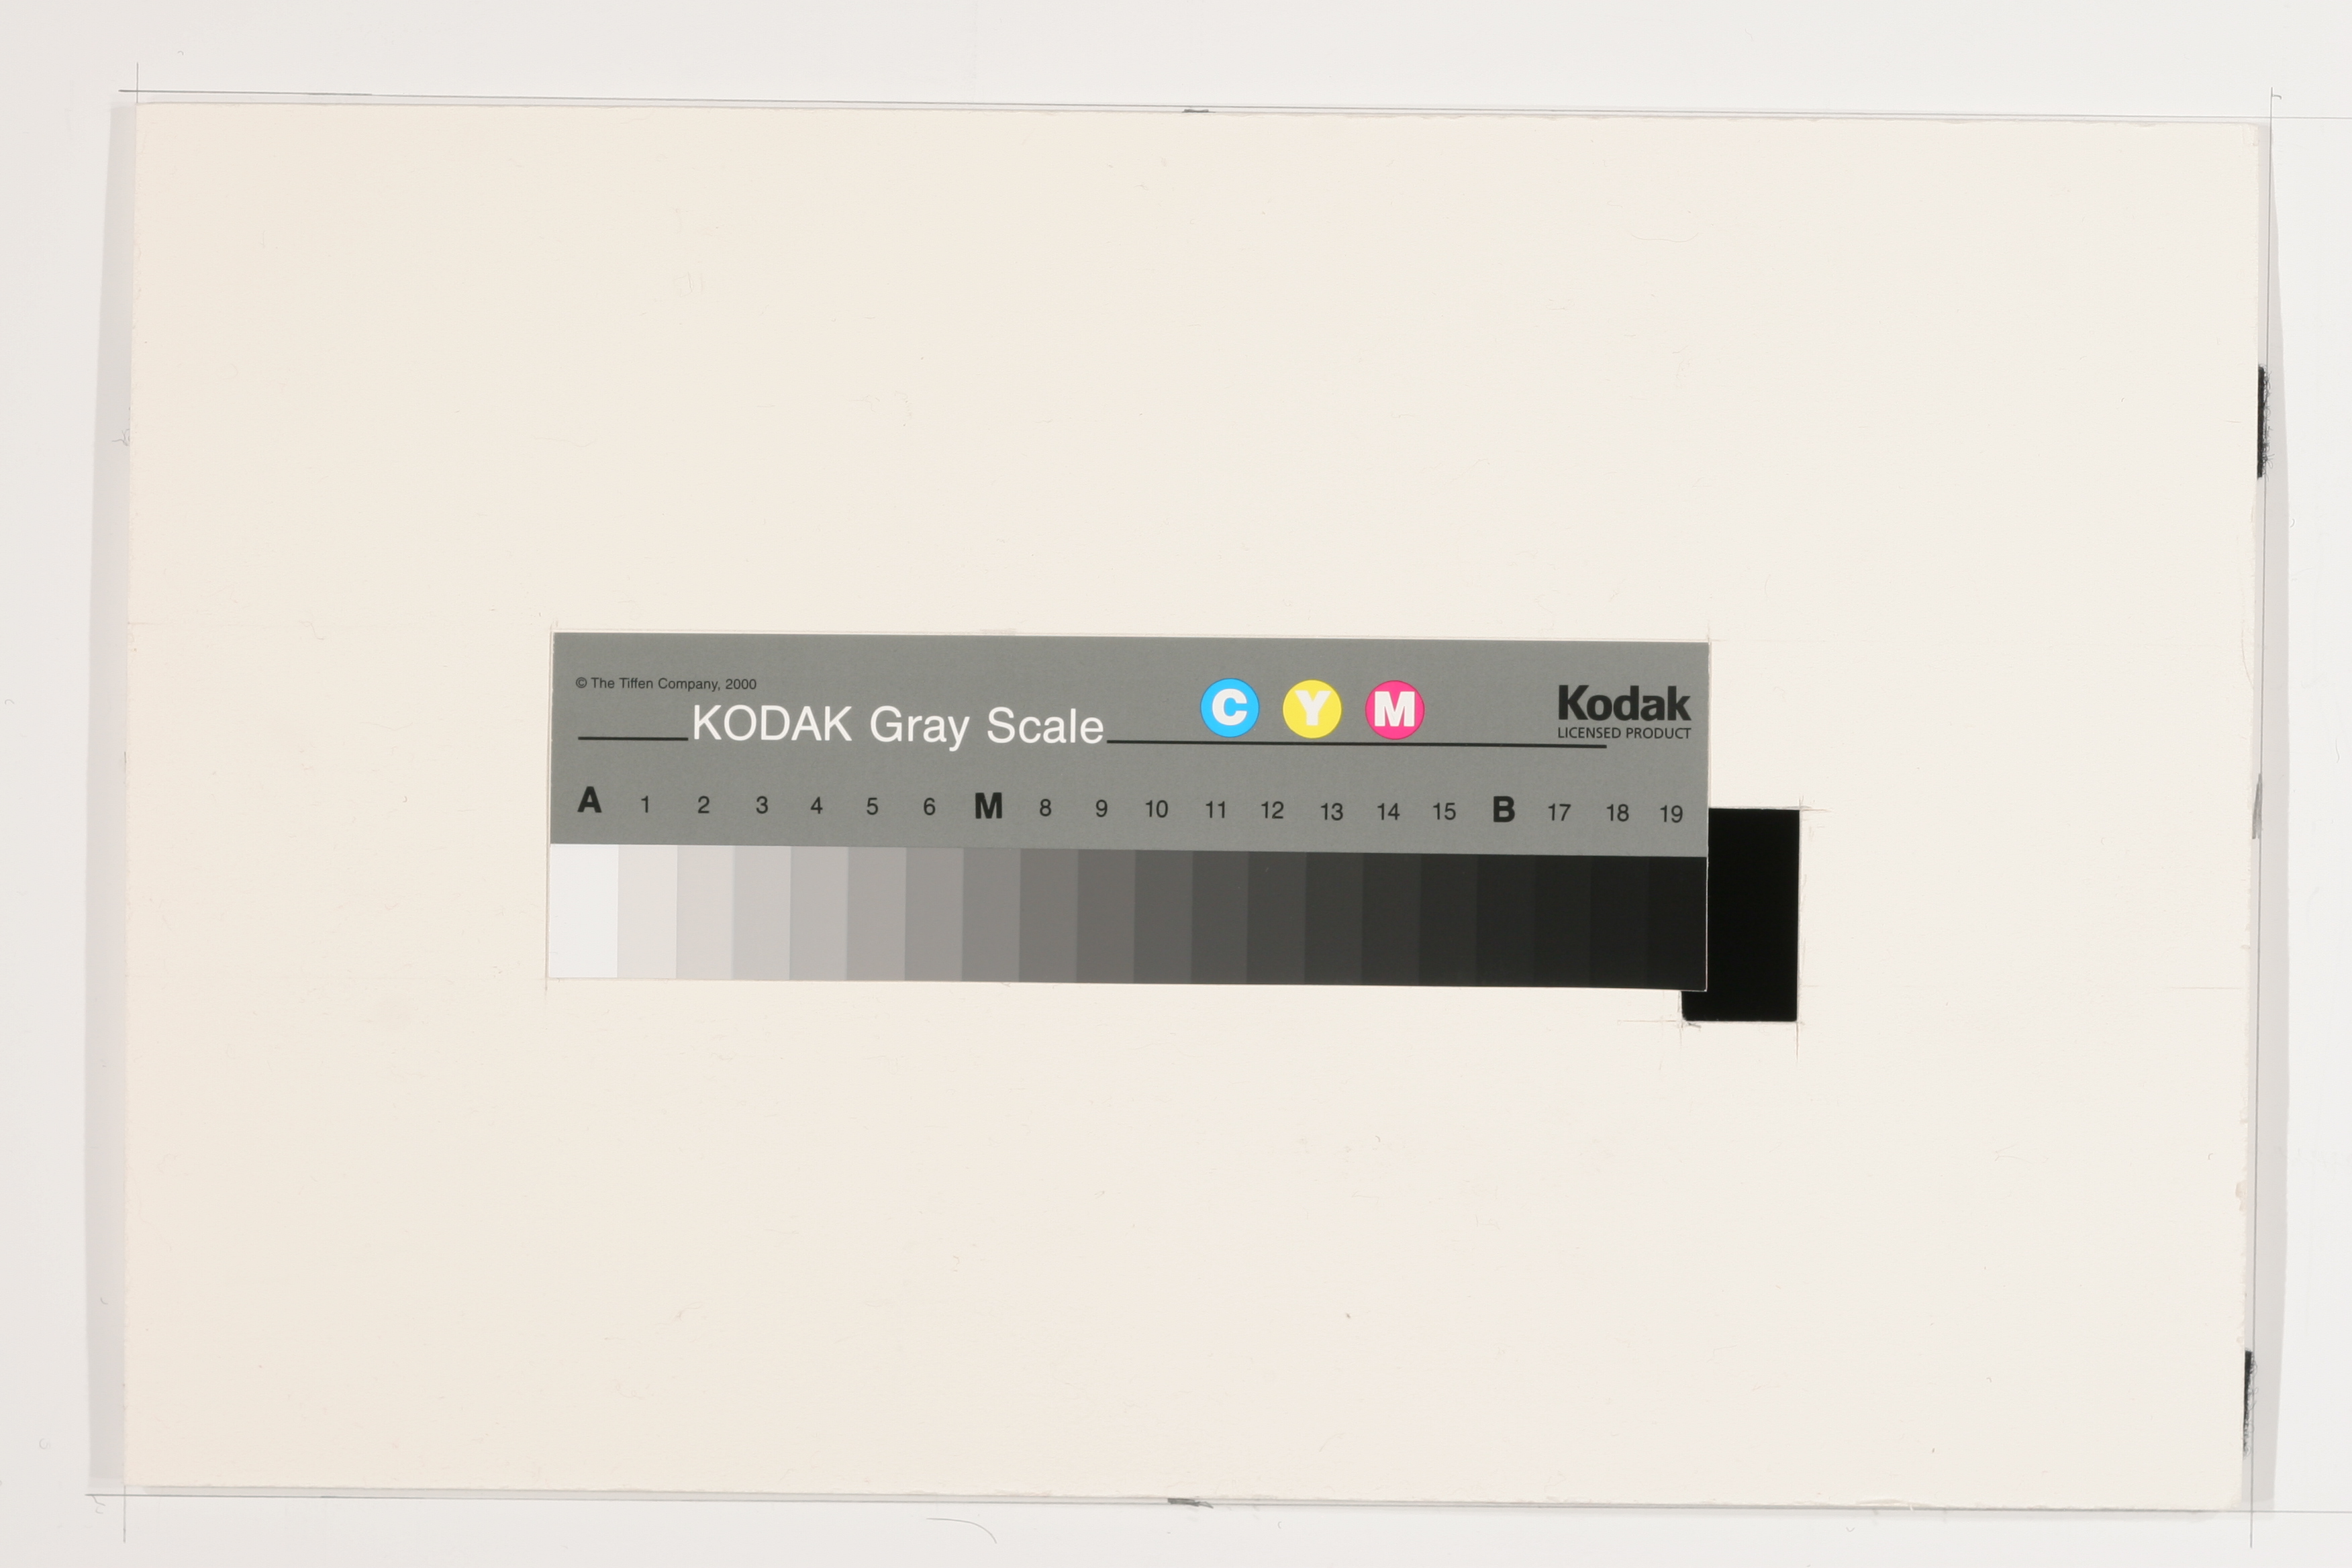
| Exposure accuracy | Step chart (reflective) such as the Kodak Q-13/Q-14 | Stepchart | |
| X-Rite ColorChecker | Colorcheck | ||
| Lateral chromatic aberration | Slanted edge (can be printed from Test Charts) | SFR Rescharts SFR SFRplus eSFR ISO |
Printable by Test Charts |
| ISO 12233:2014 | Available in a variety of media | ||
| Lens distortion | Square or rectangular grid or checkerboard (can be printed from Test Charts or displayed with Screen Patterns), SFRplus chart | Distortion SFRplus |
Grid or checkerboard printable by Test Charts. |
| Light falloff (uniformity), vignetting | plain, uniformly lit surface | Uniformity | Best: Screen Patterns with LCD flat screen. |
| Noise | Step charts such as the Kodak Q-13/Q-14 | Stepchart | |
| X-Rite ColorChecker | Colorcheck | ||
| Sharpness (MTF) from slanted-edges | Slanted-edge (can be printed from Test Charts) ISO 12233:2014 (eSFR ISO) |
SFR Rescharts SFR L |
Printable by Test Charts. Some versions printed on photographic media. |
| SFRplus chart (highly automated) | SFRplus | Printable or purchase from the Imatest store | |
| ISO 12233:2014 Edge SFR (eSFR ISO) | eSFR ISO | Printable or purchase from the Imatest store | |
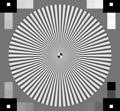
| Sharpness (MTF) from other targets | Log Frequency, Log F-Contrast, Star chart, Random scale-invariant, Spilled coins |
og Frequency Log F-Contrast Star Chart |
Printable or purchase from the Imatest store |
| Veiling glare (lens flare) | Reflective step chart with “black hole” | Stepchart | |
| Color moiré | Log Frequency | Log Frequency | Part of Rescharts |
| Software artifacts | Log F-Contrast | Log F-Contrast | Part of Rescharts |
| Data compression | Log F-Contrast | Log F-Contrast | Not yet fully supported |
|
Prints
|
|||
| Dmax (deepest black tone) | Custom test chart printed from file, scanned on profiled flatbed scanner |
Print Test | Gamutvision extracts these properties from ICC profiles. |
| Color gamut | |||
Modules
Modules are listed on the Tour page.
| Module | Quality factor | Charts | Comments |
| Colorcheck | Color accuracy, Tonal response, Contrast, | X-Rite ColorChecker | |
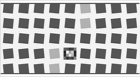
| Distortion | Lens distortion | Square or rectangular grid | |
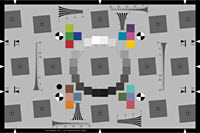
| eSFR ISO | Sharpness (MTF), Lateral chromatic aberration, Tonal response, Lens distortion | ISO 12233:2014 Edge SFR (E-SFR) chart | Highly automated module: no manual ROI selection. Chart available from the Imatest store. |
| Uniformity | Light falloff, vignetting | plain, uniformly lit surface | |
| Multicharts (Interactive module) |
Color accuracy, Tonal response, Contrast, Noise | X-Rite ColorChecker, IT8.7, ColorChecker SG, Step charts, special charts: ISO-16067-1, QA-62, EIA Grayscale, ISO-14524 OECF, ISO-15739 Noise, 20-patch OECF charts | Interactive module for measuring a large variety of color and grayscale charts. |
| Multitest (Fixed module) |
Color accuracy, Tonal response, Contrast, Noise | Fixed (batch-capable) module for measuring a large variety of color and grayscale charts (all charts supported by Multicharts). | |
| SFR | Sharpness (MTF), Lateral chromatic aberration | Slanted-edge (printable by Test Charts), ISO 12233 | Also measures Subjective Quality Factor (SQF). |
| SFRplus | Sharpness (MTF), Lateral chromatic aberration, Tonal response, Lens distortion | SFRplus chart | Highly automated module: no manual ROI selection. Chart available from the Imatest store. |
| Stepchart | Tonal response, Contrast, Noise, Dynamic range, Exposure accuracy, Veiling glare (lens flare) | Step charts, Special charts: ISO-16067-1, QA-62, EIA Grayscale, ISO-14524 OECF, ISO-15739 Noise, 20-patch OECF charts | Special charts in Imatest Master only. Transmissive charts such as the Stouffer T4110 recommended for DR. |
| Dynamic Range | (Postprocessor for Stepchart) Tonal response, Dynamic range | Reflective step charts such as the Kodak Q-14/Q-14. | Usually more convenient than Stepchart for measuring DR because it doesn’t require a transmission chart, special light source, and darkened room. |
| Print Test | Dmax (deepest black tone), Color gamut | Custom test chart printed from file, scanned on profiled flatbed scanner |
Gamutvision extracts these properties from ICC profiles. |
| Log Frequency | Sharpness (MTF), Color moiré | Log Frequency (can also use Log Frequency-Contrast chart) | Part of Rescharts |
| Log F-Contrast | Sharpness (MTF), Software artifacts | Log Frequency-Contrast | Part of Rescharts |
| Star Chart | Sharpness (MTF) | Star chart | Part of Rescharts |
Test charts
This list is primarily commercially-available test charts. You can print out additional charts from files generated by the Test Charts module.
| Chart | Quality factor | Module | Comments |
|
Recommended charts
|
|||
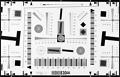
| Sharpness (MTF), Lateral chromatic aberration, Tonal response, Lens distortion | SFRplus | Available in the Imatest Store in several sizes, media (transmissive and reflective), and options (pre-distorted, etc.).
Designed to measure several key image quality factors from a single image with a high degree of automation: no manual ROI selection. SFRplus operates interactively inside Rescharts or as a fully automated module with no user intervention. Has numerous advantages over the old ISO-12233 chart, listed here. |
|
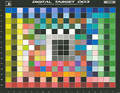
| Sharpness (MTF), Lateral chromatic aberration, Tonal response, Lens distortion | eSFR ISO | Available in the Imatest Store in several varieties, sizes, and media (transmissive and reflective).
Designed to measure several key image quality factors from a single image with a high degree of automation: no manual ROI selection. eSFR ISO operates interactively inside Rescharts or as a fully automated module with no user intervention. Has numerous advantages over the old ISO-12233:2000 chart, listed here. |
|
 chart") Spilled Coins chart |
Texture, Sharpness | Random | Available from the Imatest Store: Color, Monochrome. Imatest Master & Image Sensor-only. Color or Black & White available. |
| Tonal response, Noise, Dynamic Range | Available from the Imatest Store. Imatest Master &Image Sensor-only. Density range ≥ 3.4. Near-circular design minimizes effects of light falloff. Automatic region selection available. Much easier to use than other transmissive stepcharts. |
||
| Color accuracy, Tonal response | Multicharts, Multitest |
Available from the Imatest Store. Imatest Master & Image Sensor-only. |
|
| Color accuracy, Tonal response, Noise | Colorcheck, Multicharts, Multitest |
Available from the Imatest Store.
Widely available; consistent pigments. A compatible chart is available from Danes-Picta. |
|
| Color accuracy, Tonal response | Multicharts, Multitest |
Available from Wolf Faust
Requires reference file |
|
| Dynamic range, Tonal response, Contrast | Stepchart, Multicharts (Special charts), Multitest |
Imatest Master only. |
|
 ISO-15739 (Noise) |
Dynamic range, Tonal response, Contrast | Stepchart, Multicharts (Special charts) Multites |
|
|
Step charts (reflective): Kodak Q-13, Q-14, etc. |
Tonal response, Contrast, Noise, Exposure accuracy, Veiling glare | Stepchart, Multicharts. Dynamic Range |
Veiling glare is measured with “black hole” next to the Q-13. May be purchased from professional camera stores or Danes-Picta. |
|
Other transmissive
step charts: Stouffer T4110, etc. |
Dynamic range, Tonal response, Contrast, Noise | Stepchart, Multicharts, Multitest |
For measuring dynamic range |
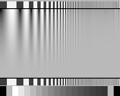 Log Frequency, Log F-Contrast (sine or bar) |
Sharpness, Color moiré, Detail lost to software noise reduction | MTF can be a check on the slanted-edge method; more direct but less accurate. | |
| Sharpness | Star chart | Imatest Master/Image Sensor-only. May be created for printing by Test Charts. Will be available on the Imatest store. | |
|
Other charts |
|||
| Sharpness, Lateral chromatic aberration, Subjective Quality Factor (SQF) | SFR | Printed on high resolution photographic media. Slanted-edge charts printed on a high quality inkjets can perform the same function, but aren’t as fine. No longer supported in the ISO 12233:2014 standard. The SFRplus chart has numerous advantages, listed here. |
|
 Other Monochrome charts: ISO-16067-1, QA-62, EIA Grayscale, 20-patch OECF charts |
Multicharts, Multitest |
||
| Color accuracy, Tonal response | Multicharts, Multitest |
Imatest Master & Image Sensor-only. | |
| Color accuracy, Tonal response | Multicharts, Multitest |
Imatest Master & Image Sensor-only. | |
|
QPcard 201 |
Color accuracy, Tonal response | Multicharts, Multitest |
Inexpensive chart |

Test images
These images were put online for testing Imatest API/EXE, but they are generally useful for testing Imatest. This is not a comprehensive list of charts, which can be found in the above table.
| Module | Image file | Description |
| Webcam image of high and medium contrast custom charts created by Test Charts and printed on an Epson R2400 printer: these can have larger regions of interest (ROIs) than the ISO 12233 chart below. | ||
 125 kB SFR_webcam_A_ISO_80cm.jpg 125 kB SFR_webcam_A_ISO_80cm.jpg |
Webcam image of ISO 12233 chart. At this distance the available regions of interest are very small. | |
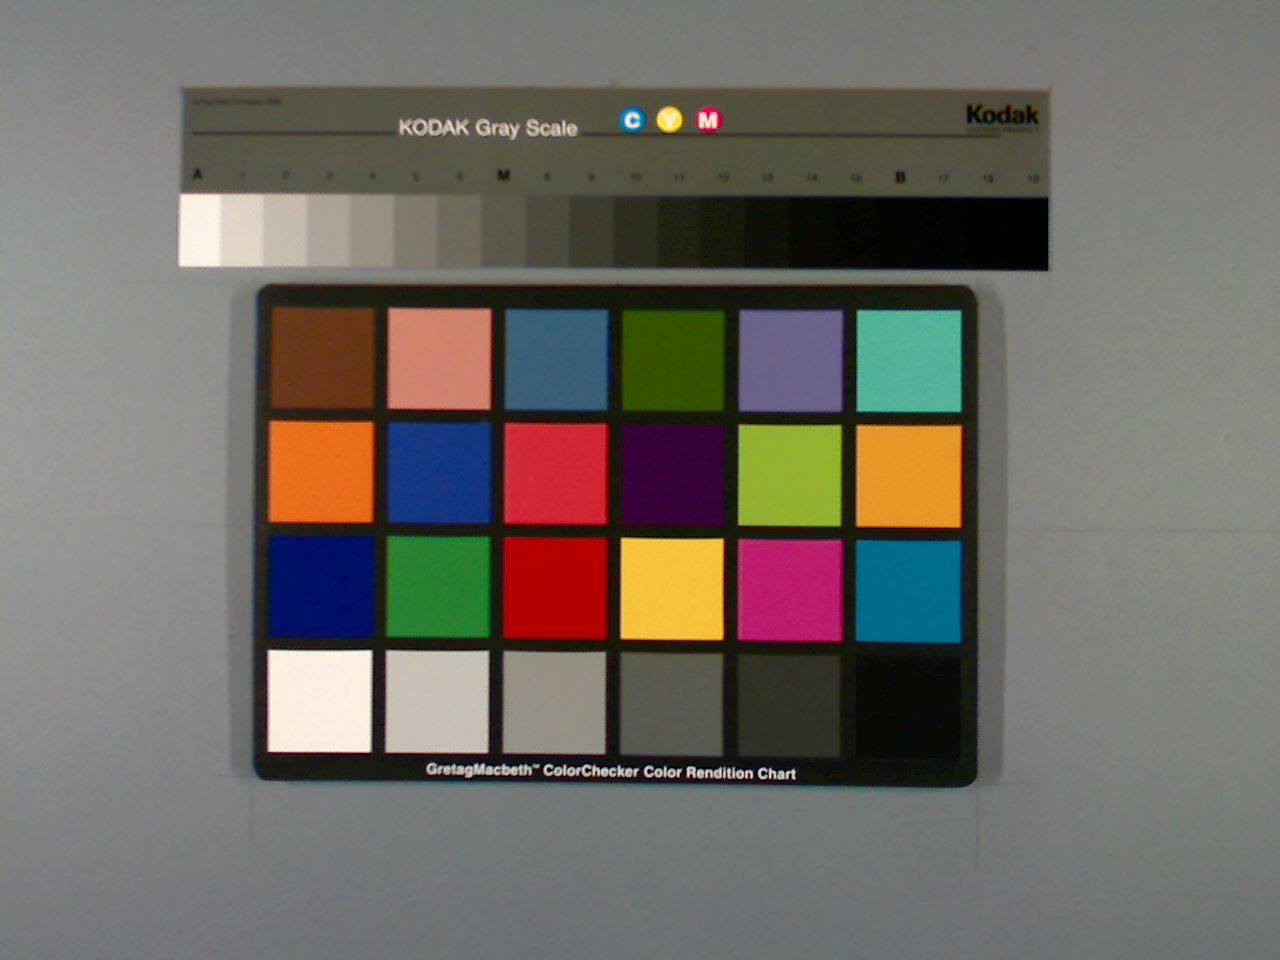
| Webcam image of the Kodak Q-14 grayscale and X-Rite ColorChecker. | ||
 248 kB Stepchart_DR_Canon_G2.JPG 248 kB Stepchart_DR_Canon_G2.JPG |
Image of the Stouffer T4110 transmission test chart taken with the Canon Powershot G2. Excellent dynamic range measurement. | |
|
(image in Colorcheck, above)
GMB_Q-14_webcam.jpg |
Webcam image of the Kodak Q-14 grayscale and X-Rite ColorChecker. | |
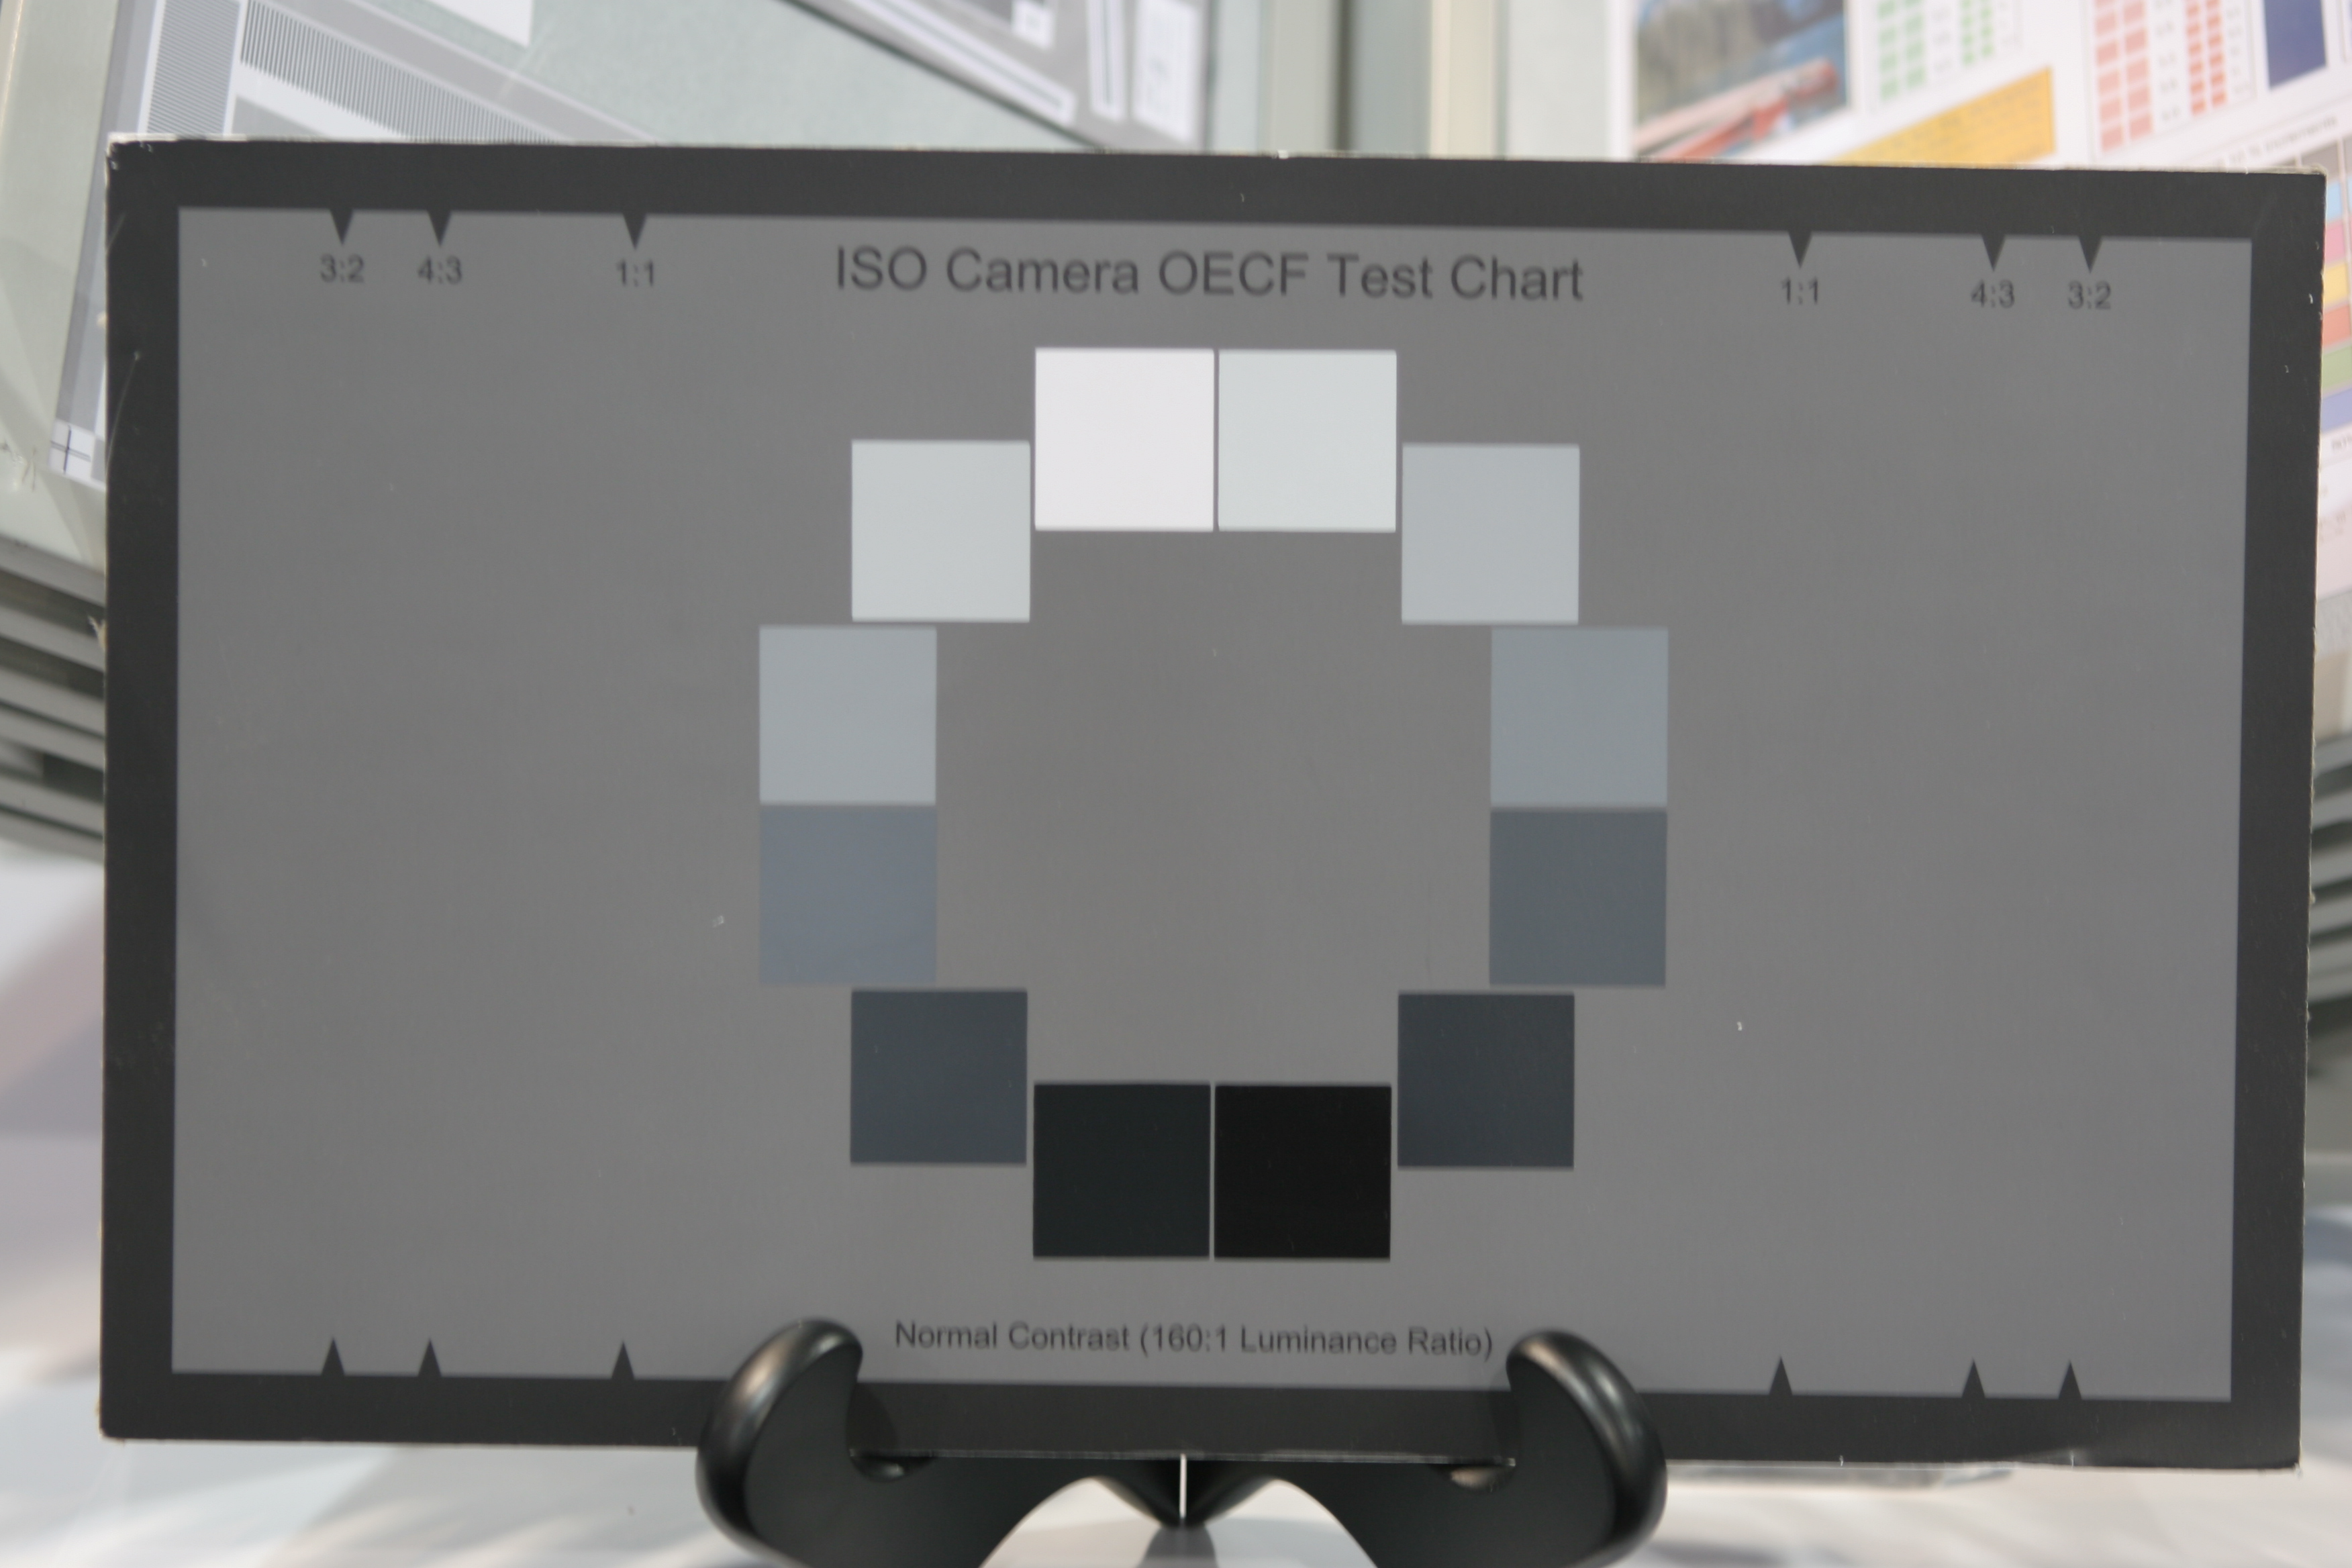 1.68 MB Stepchart_OECF_1159.JPG 1.68 MB Stepchart_OECF_1159.JPG |
12-patch OECF chart (for API and Imatest Master only ). Available from Imatest Store. | |
 1.72 MB Stepchart_Can_TS90_8_1869.JPG 1.72 MB Stepchart_Can_TS90_8_1869.JPG |
Image of Kodak Q-14 chart with “black hole” cavity for measuring veiling glare (susceptibility to lens flare) | |
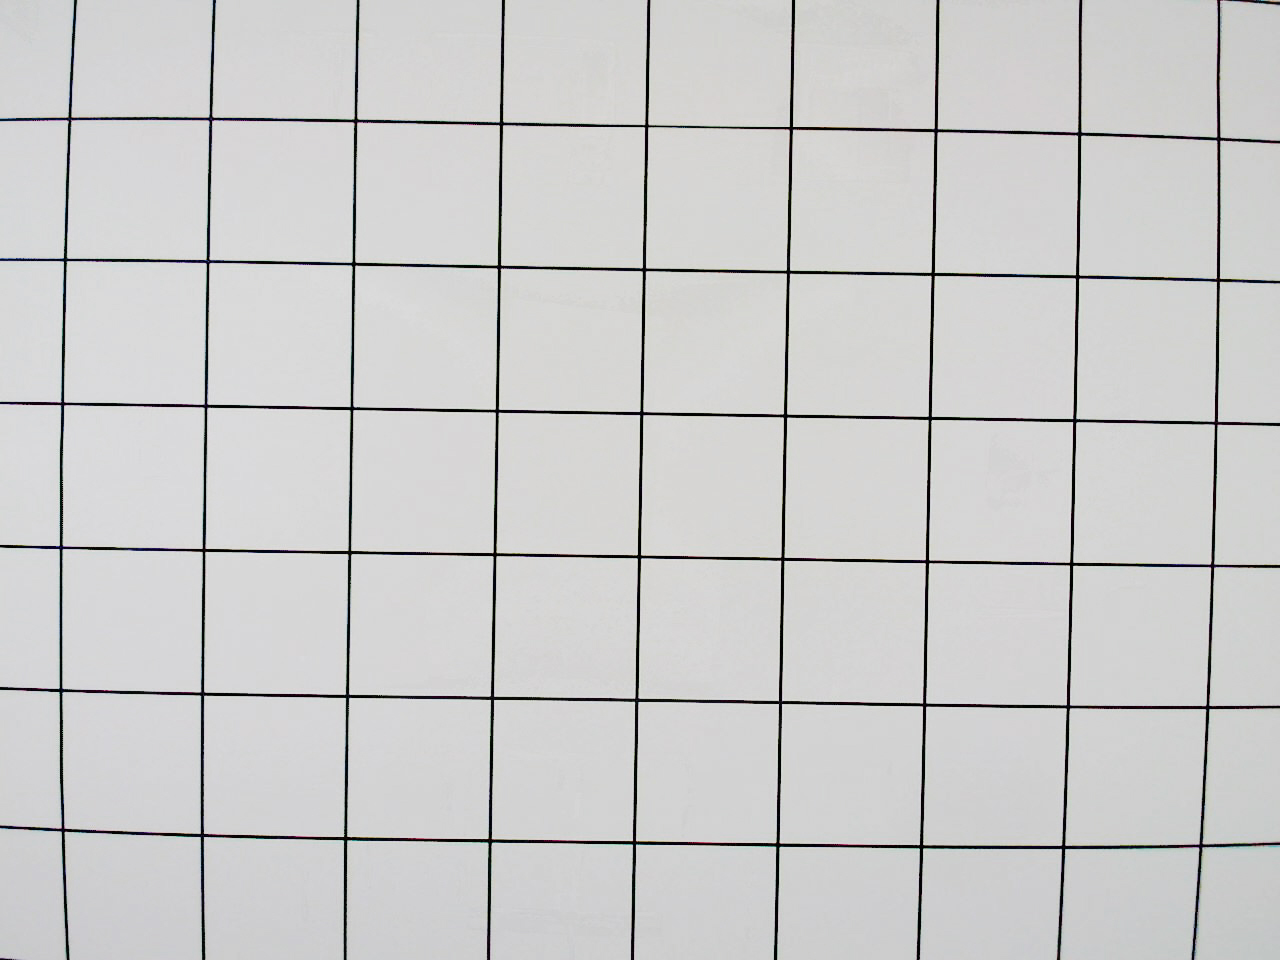 204 kB 204 kB distortion_webcam_a.jpg |
Webcam image of distortion grid. | |
 185 kB 185 kB uniformity_1600_JPEG80.jpg |
Image of nearly uniformly illuminated surface taken with the Canon 10-22mm lens on the EOS-20D, f/4.5, 22mm, ISO 1600. | |
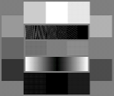
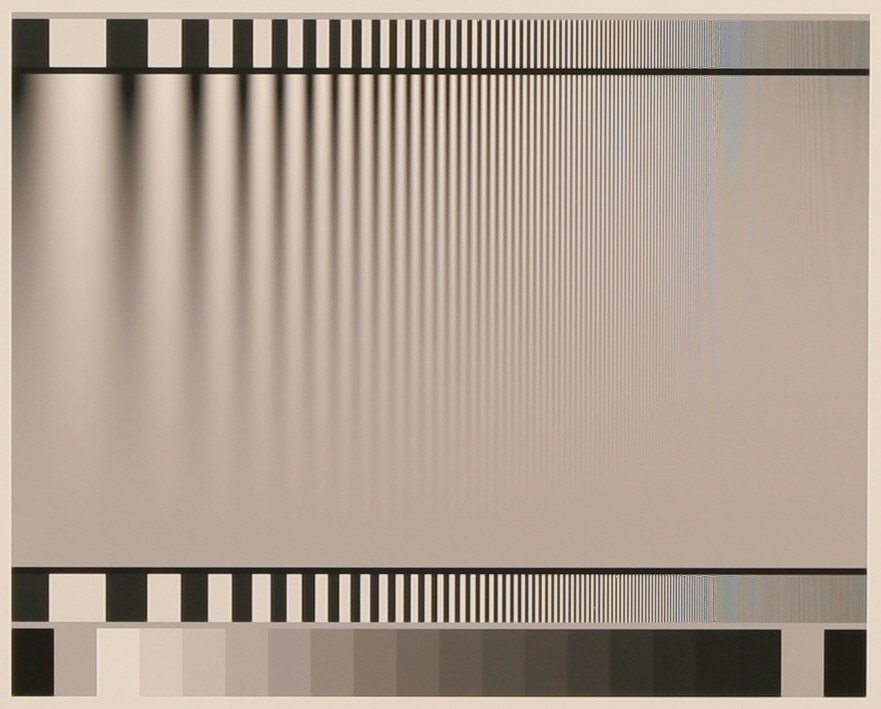
| Image Log-Frequency-Contrast chart (cropped), acquired by the EOS-20D camera, 24-70mm f/2.8L lens set at 42mm, f/5.6, ISO 100. Can also be used with Log Frequency. |

Algorithms
| Module | Algorithm link | Brief description |
| Stepchart | www.imatest.com/docs/stepchart#Algorithm | |
| Slanted-edge MTF measurement. The calculation is derived from ISO-12233. The average edge is calculated using a 4x oversampling binning algorithm. MTF is the Fourier transform of the derivative of the differentiated edge (the average line spread function (LSF)). The Imatest algorithm is more immune to noise and lens distortion than the standard ISO algorithm, which can be selected in a checkbox if desired. |