Analyze color and grayscale test charts
in a fixed batch-capable module
Color/Tone Auto (Multitest) incorporates all calculations in Color/Tone Setup (Multicharts), Colorcheck, and Stepchart.
|
News– Imatest 2020.1 We have added support for the TE269V2 dynamic range chart. Imatest 5.2: We’ve changed the name Multitest to Color/Tone Auto, but we’ll continue to use Multitest for a while (for example, for Imatest IT). Imatest 5.1: (starting December 2018) The exposure error calculation has been improved to be more consistent over a range of contrast (gamma) values. Details here. Color/ToneSetup and Color/Tone Auto can now measure temporal noise and SNR. With this enhancement, these two new modules have all major features of the older Stepchart and Colorcheck modules, which are not recommended for new work. |
|
Using Color/Tone Interactive (Multicharts) – Interactive analysis of color & grayscale test charts Using Color/Tone Auto – Fixed (batch-capable) analysis of color & grayscale test charts Color/Tone / eSFR ISO Noise – including chroma, sensor (RAW), and visual noise Dynamic Range – a general introduction with links to Imatest modules that calculate it. Color Correction Matrix (CCM) Calculate a matrix (usually 3×3) for correcting image colors (often from RAW images) |
Introduction – Getting started – Running – Color/Tone dropdown – Settings window – Reference files
Imatest IT (Industrial Testing) settings – Appendix: INI File Monitor
Introduction
Imatest™ Color/Tone Auto (formerly Multitest) (not available in Imatest Studio) analyzes images of a large variety of test charts for color accuracy, tonal response, noise, SNR (Signal-to-Noise Ratio) and ISO sensitivity using fixed interface that can run batches of images. It can measure white balance and color response for a wide range of lighting conditions and scenes. It can also display the tonal response of monochrome charts (or monochrome sections of color charts). A color correction matrix can be calculated.
Color/Tone Auto can analyze all the charts supported by Color/Tone Setup (formerly Multicharts) and can produce most of the results plots. It can also incorporates all important functions of the Colorcheck and Stepchart modules: it is similar in operation, but able to analyze more charts and display more results.
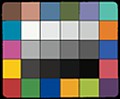
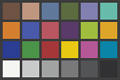 24-patch 24-patchColorchecker |
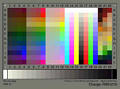 IT8.7 IT8.7 |
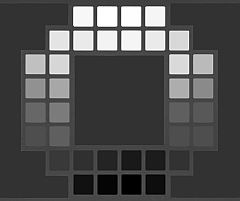
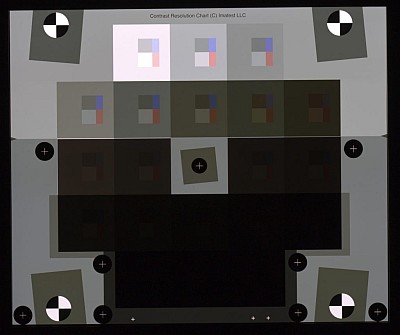 Contrast Resolution Contrast Resolution |
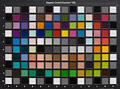 Colorchecker SG |
|||||
|
|
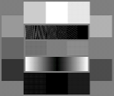
Q-13/Q-14 and other grayscale stepcharts |
 ColorGauge (Micro, Nano, etc.) |
||||||
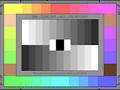
 ISO-15739 |
General mxn charts (L*a*b* reference file required) |
 TE269, TE269V2 TE269, TE269V2(2 versions) |
 ISO-14524 |
|||||
|
Also: SFRplus 20-patch color, SMPTE/Hale Color Bars (6 patches), TE226 (9×5) chart
|
||||||||

A full list of supported charts can be found on Color/Tone– Supported charts.
Getting started
Photograph the chart, taking care to illuminate it evenly (±5%) and to avoid glare, which can be problematic in charts with semigloss (SG) and glossy surfaces such as the reflective IT8.7 and ColorChecker SG. Glare can be especially challenging to control with wide angle lenses. To minimize the effects of light falloff in lenses, the chart should typically not fill the image field.
A low-cost lighting setup is described Building a Low-Cost Test Lab. For testing white balance, you can photograph the chart in a scene under a variety of lighting conditions. Small versions of the ColorChecker (the Passport, the SpyderCheckr, or the ColorGauge charts) are especially suitable for this purpose. Some rectangular charts may be rotated by multiples of ±90° if they are geometrically symmetrical (these include the two Colorcheckers and the Kodak/Tiffen Q-13/Q-14, but not the IT8.7 (where top and bottom are different).
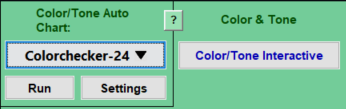 Before you run Color/Tone Auto you can select the chart type to analyze by clicking on the button in the green Color & tone area of the Imatest main window, as shown on the right. You can also click on the Color/Tone dropdown menu (which contains on the right) to select and run the chart type, or click on to run the selected chart type. These open the Color/Tone Auto settings window, shown below.
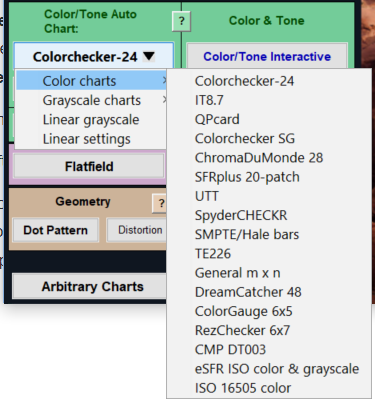
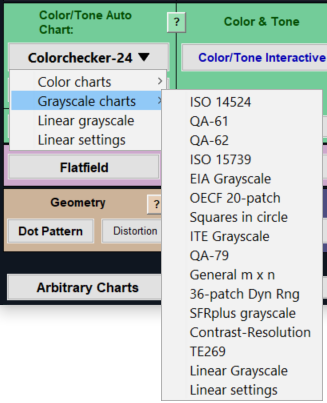
The Color/tone dropdown menu, shown below contains all available chart settings.
After a selection has been made it is saved and displayed in the Color/Tone dropdown menu. Available selections are shown in submenus below.
|
Chart selection dropdown menus (Left) for color charts. Settings correspond to chartMultitest; chartClassMultitest = 1 (Right) for grayscale charts Settings correspond to altchartMultitest; chartClassMultitest = 2 (3 for the last two Linear settings) |
 |
 |
Additional settings can be changed at this time or after an image file has been read and the Region of Interest (ROI) selected (unless you’ve selected Express mode)— but since Chart Type always affects the next run, a selection should be made before a new chart type is run.
Automatic region detection
This is also a good time to select automatic or manual region detection, either with the button, located at the bottom-right of the Imatest main window or at the bottom of the Color/Tone Auto settings window. The exact selection depends on the chart type. The Colorchecker-24, the Rezchecker, the 36-patch Dynamic Range chart, and the Contrast Resolution chart support auto detection.
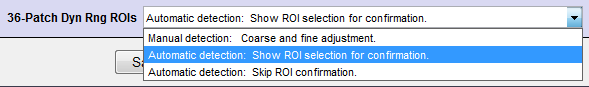 Manual/Automatic ROI selection, located at the bottom of the Multitest settings window
Running Color/Tone Auto
To start Color/Tone Auto, run Imatest, then click the button. A window will open for selecting the file (or batch of files).
To calculate temporal noise, select either two files (for the Imatest-recommended difference method) or 4-16 files (for the ISO 15739 method). Details of the calculation are can be found here.
If you have selected manual ROI detection, after you make the file selection, Imatest will check to see if the image(s) are the same size as recently-run images (it saves several sizes). If it is the same size you’ll be asked if you want to repeat the same Region of Interest (ROI) selection:
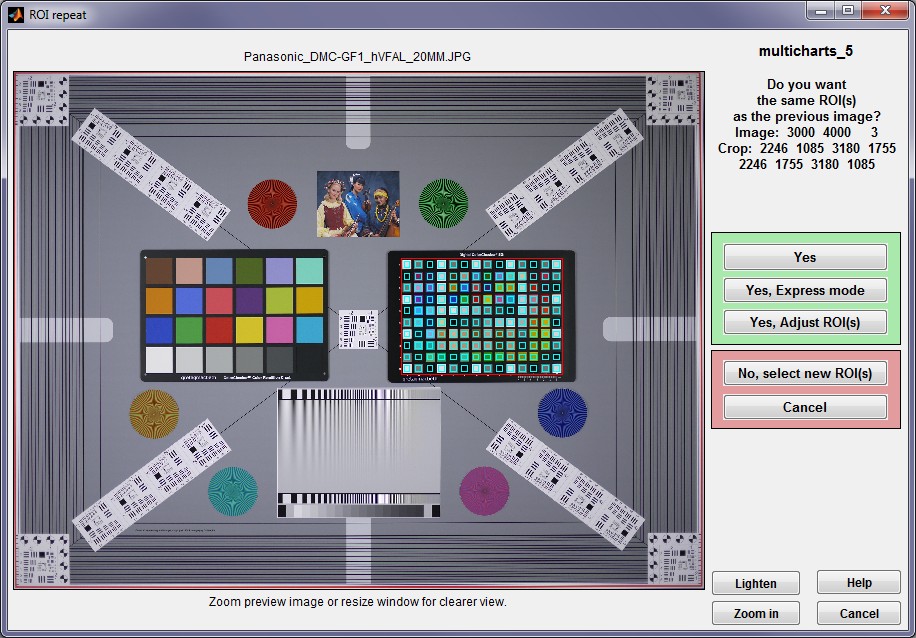
ROI repeat window (appears when image is the same size as a previously-run image). Manual ROI detection.
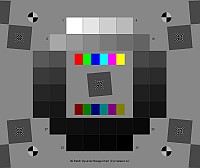
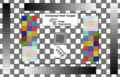
If the image is not the same size as a previous image or if you click , a window will open asking you to select the region. Do this by drawing a rectangle from one to another corner of the chart you want to analyze. Don’t worry about getting the region exactly right— you’ll be able to refine it.
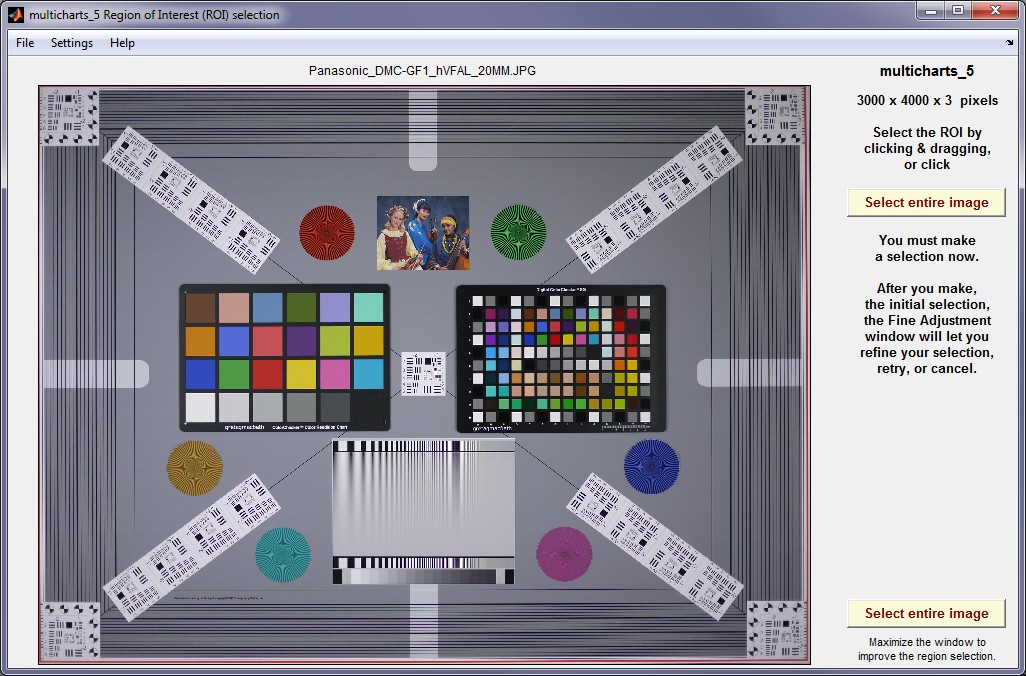
Initial (coarse) region selection. Draw a rectangle from corner to corner of the chart.
Image from Imaging-resource.com (the Multi-Target from the Samples page for individual camera reviews).
Refine the selection in the fine selection window that opens after you make the coarse selection. The inner squares are different for different charts. (Note: this window will appear if you’ve selected Automatic ROI detection with confirmation with one of the charts that support automatic detection.)
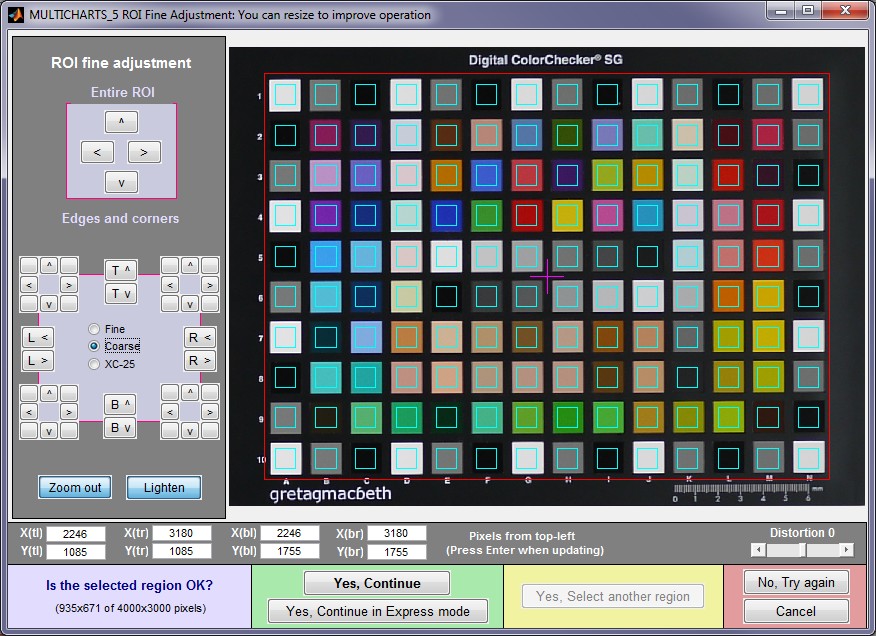
Fine region selection, shown for the ColorChecker SG
- The entire ROI can be moved ( ^ > v < , upper-left).
- The top, bottom, left, or right sides can be moved ( T^ Tv R> R< B^ Bv L> L< , middle-left).
- Corners can be moved individually (any of the 8 buttons in each of the four corners, middle-left).
- Pixel values for the four corners can be entered (X(tl), Y(br), …, where tl = top-left, br = bottom right, etc.). The origin is the upper-left. Be sure to press the Enter key after entering a value.
- You can choose between Fine, Coarse, or Extra Coarse (XC-25) movement (1, 5, or 25 pixels of movement per click).
- The display can be zoomed out or in.
- The display can be lightened to view the dark regions more clearly.
- For some charts (those with relatively large patches) a Fill factor (linear) slider to the left of the Distortion slider specifies the relative size of the squares. Its default value is 0.5. Smaller values can be used where lens distortion or pattern alignment makes alignment difficult.
- The Distortion slider allows highly distorted images (barrel or pincushion) to be analyzed.
Settings window — When you have completed the fine adjustment, click one of the buttons on the bottom of the window. If you click , the Color/Tone Auto settings window, shown below, will open. If you click Color/Tone Auto will run, display selected results Figures, and save selected results files.
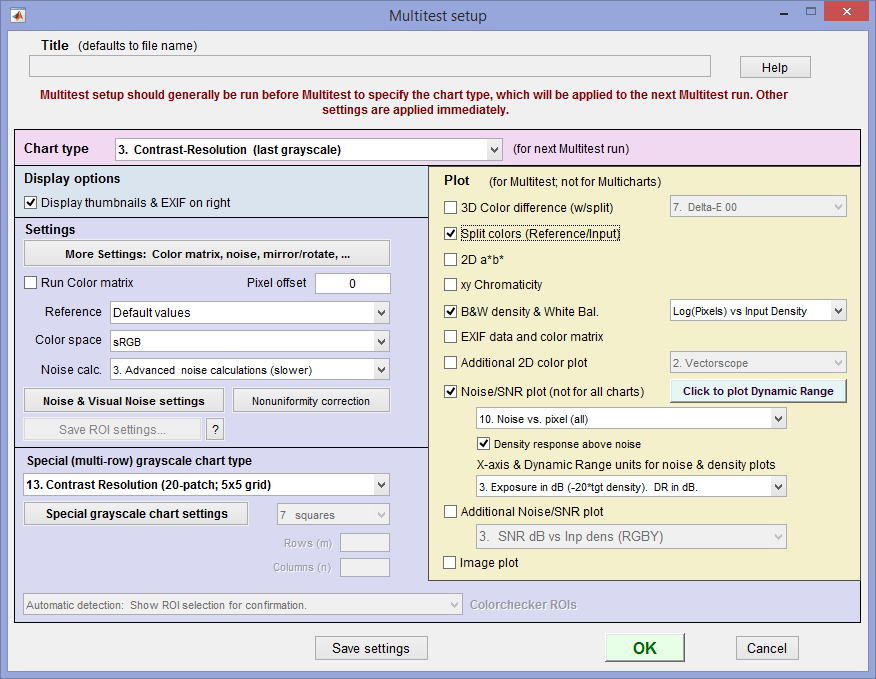 Color/Tone Auto settings window
| Chart type | Selects the Chart type. Applied to the next run. If Chart type 3 (last grayscale) or 7 (Multi-Row grayscale Stepcharts (not linear)) is selected, the specific chart type should be selected in the Special (multi-row) grayscale chart type dropdown menu, below. |
| Opens the Color/Tone settings window, shown below. Lets you select Color Matrix settings (described in the Color Correction Matrix web page), noise settings, ISO speed calculation, mxn chart settings, and more, as described below. | |
| Run Color Matrix | Calculates and applies a Color Correction Matrix (CCM) if checked. |
| Reference | Reference file. Can be standard or read in (typically from a CSV or CGATS L*a*b* or density file). Varies somewhat with the chart type. |
| Color space | Color space |
| Noise calc. | Noise calculations. Select 1. No (non-visual) noise calculations (fastest), 2. Elementary noise calculations (slower), or 3. Advanced noise calculations (slower). |
| Noise & Visual noise settings | Opens the Noise and visual noise window, described in Color/Tone Interactive / Auto /eSFR ISO Noise. Lets you select visual noise and other settings. |
| Nonuniformity correction | Allows you to correct for nonuniform illumination using a separate flat field image taken under identical conditions. Opens the Nonuniformity correction window described in Nonuniformity Correction in grayscale and color chart modules. |
| Special (multi-row) grayscale chart type | Visible only when Chart type 3 (last grayscale) or 7 (Multi-Row grayscale Stepcharts (not linear)) is selected. Use to select the appropriate grayscale chart type. |
| Special grayscale chart settings | Opens a window that lets you select density increment for linear grayscale stepcharts. |
| Display thumbnails & EXIF on the right | Display thumbnails of the entire image and crop as well as EXIF results to the right of the plot. Examples will be shown below. |
| Plot settings (on right) | Selects output figures. Described below. |
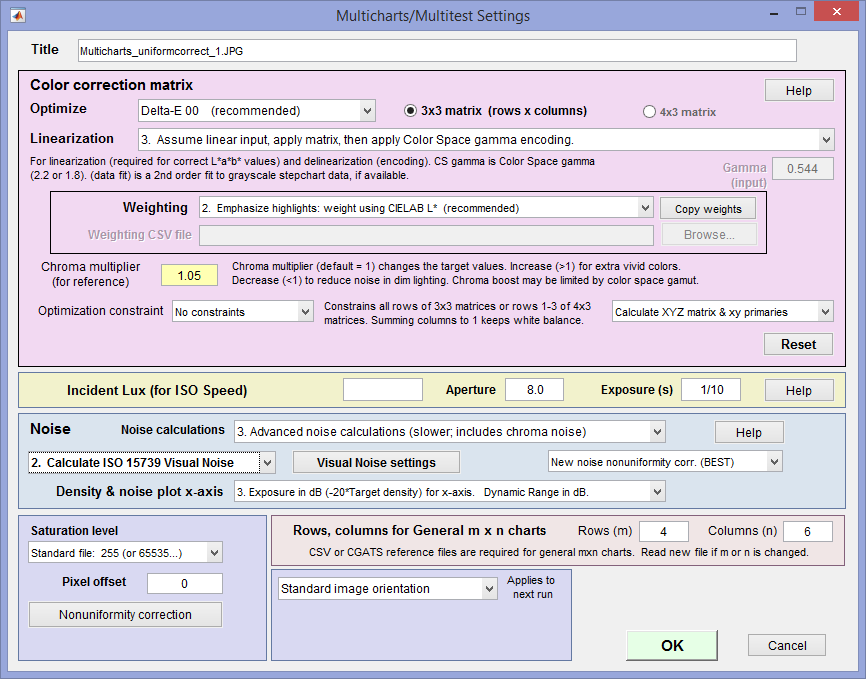 Color/Tone settings window.
| Color correction matrix | Settings for the CCM calculation are described in the Color Correction Matrix page |
| Incident Lux | Must be manually entered for ISO Sensitivity (Exposure Index) calculations. Aperture and Exposure (s) are normally obtained from EXIF data, but may be entered manually if the EXIF data is absent. |
| Noise | Settings are described in the Color/Tone/eSFR ISO Noise page. |
| Rows, columns for General mxn charts |
Select number of rows and columns for general mxn (rectangular) charts. A reference file is required for this chart selection. |
| Saturation level | Three settings that affect Dynamic Range calculations are available: Standard file: 255 (or 65535…), ITU-R Rec. 601 (BT.601): 235, Maximum detected patch level (useful when 255 can’t be reached). |
| Pixel offset | Enter the pixel offset to subtract from the data. Pixel offsets are not uncommon: they cause a premature flattening of Density curves. |
| Nonuniformity correction | Allows you to correct for nonuniform illumination using a separate flat field image taken under identical conditions. Opens the Nonuniformity correction window described in Nonuniformity Correction in grayscale and color chart modules. |
| Image orientation | (Applies to next read) Select among Standard image orientation, Mirror (H-flip), Mirror (V-flip), Rotate 180 degrees. |
Reference files
Most charts allow reference files to be entered using the Reference dropdown menu in the Settings area. (IT8.7 and CMP DT003 charts require them.) The available settings depends on the chart type. The previous file is generally available in the dropdown list. Here is a summary of the available reference sources.
| Chart | Default values | Options (data from files) |
| X-Rite ColorChecker (24-patch) |
Default values from GMB, BabelColor, or Danes Picta (a chart with the same geometry but different colors) | L*a*b*, xyY D50, or xyY D65 files in CSV format. |
| IT8.7 | Requires a reference file in IT8.7 format, available from the chart manufacturer, generally available on their websites. | — |
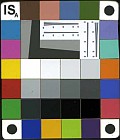
| Rezchecker | You can use the standard default reference or NIST-traceable measurements provided by ISA. These measurements are in a difficult-to-use XLS/CGATS file format. To use this data, open the file in Google sheets (which can be done directly in Gmail) or in Excel. Select the 30 rows representing the patches and the 3 column representing LAB L, LAB A, and LAB B, and copy them into the clipboard. Past into a text editor and save the file (with txt or csv extension). | |
| CMP DigitaL TargeT 003 | Individually measured reference files are supplied with each target. | — |
| X-Rite ColorChecker SG | Default values from GMB (L*a*b* D50); See Note below | L*a*b*, xyY D50, or xyY D65 files in CSV format. |
| Stepchart (linear) | Even density steps of 0.1, 0.15, 0.20, or 0.30. For the UTT only, L* = 95 to 5 in steps of -5 for the first 19 steps and 1 for step 20. (20-step UTT) should be selected. | an ASCII density reference file with one density value per line can be entered. |
| Note: Several of the default reference values are derived from L*a*b* D50 values, i.e., L*a*b* values acquired under D50 illumination. When the color space has a different reference temperature (sRGB and Adobe RGB both have D65) a Bradford transformation is applied, resulting in a small change in the L*a*b* values. This is rarely a significant concern if you’re making images under a different illuminant: if the white balance algorithm is working properly, it should transform image colors to the appropriate values for the color space. | ||
Except for the IT8.7 and CMP DT 003, reference files must be in CSV (comma-separated file) or CGATS format CSV files can be opened and edited in Excel. Color files (L*a*b*, xyY D50, and xyY D65) have three entries per line; density files have have one entry per line.
|
Here is an example of an L*a*b* file. The format is CSV (comma-separated variables). Added spaces are for visual clarity (readability) only. |
55.261, -38.342, 31.37 28.778, 14.179, -50.297 65.711, 18.13, 17.81 51.038, -28.631, -28.638 51.935, 49.986, -14.574 81.733, 4.039, 79.819 42.101, 53.378, 28.19 |
If you have a spectrophotometer you can create a custom reference file (CGATS format) using techniques described in Measuring test chart patches.
Results figures
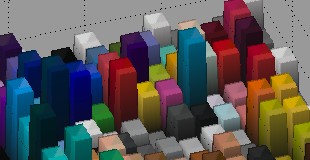
1. 3D Color Difference (with split)
In this plot, the height of the region is the selected color difference, in this case ΔE*ab (plain Delta-E). The tops of the patch platforms are shown as split colors with the reference color on the upper-left and the actual input color on the lower-right. This plot enables you to compare color measured with perceptual color differences. (They may not match as well as the theories claim.)
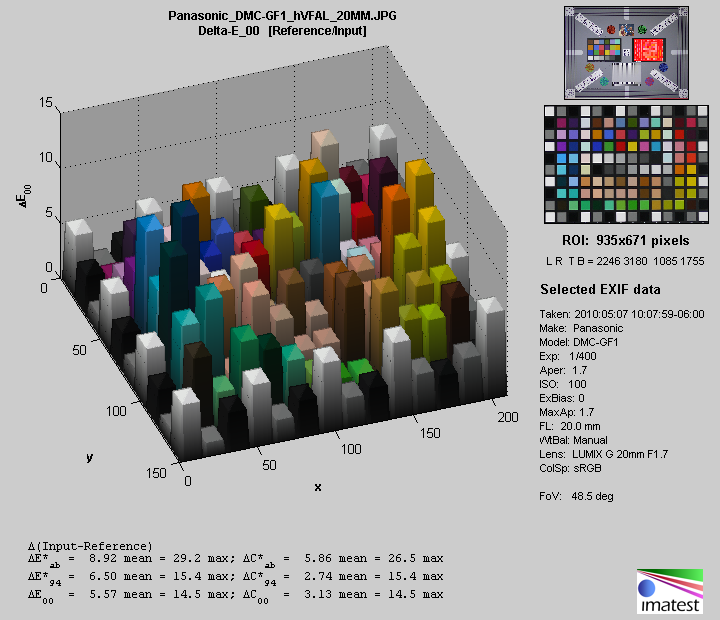
This plot is shown with the thumbnails and EXIF data on the right (set in a chckbox in the Multitest Settings window. Other plots will be shown without these results, i.e., with the box unchecked (so they take up less space).
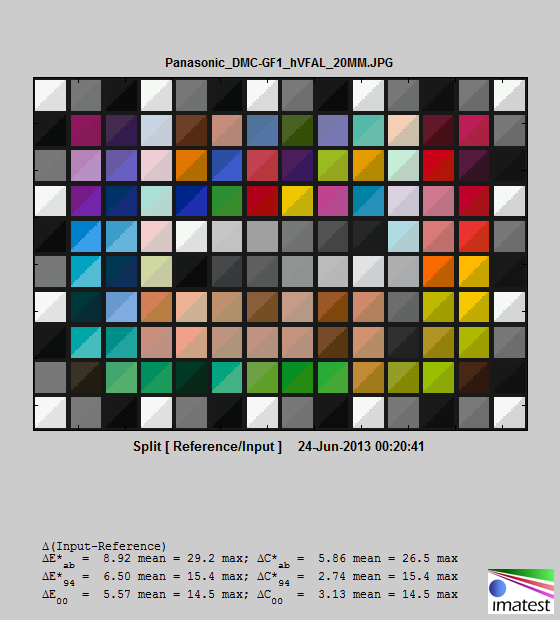
2. Split Color (Reference/Input) plotThe Split Color plot shows the reference (ideal) color on the upper-left and the input color on the lower right. If a color correction matrix has been calculated (if the checkbox has been checked), this plot and also the 3D Color Difference plot (above) will display the reference color on the upper-left, the input color on the upper-right, and the corrected color on the bottom.
Split color detail, Color Correction Matrix calculated |
|
 |
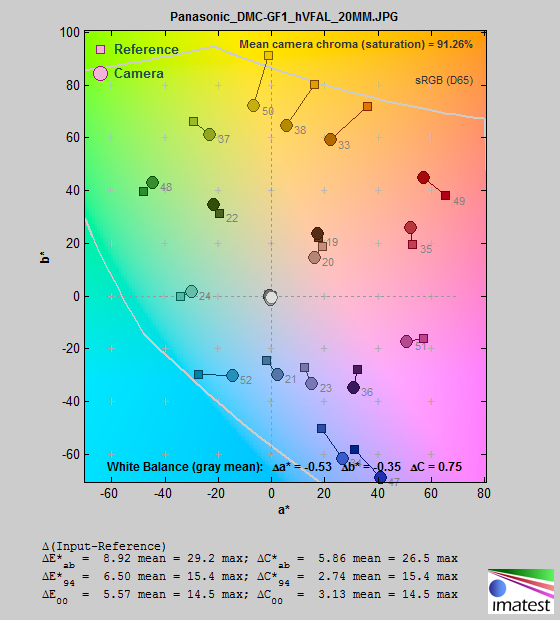
3. 2D a*b* plotDisplays the a*b* plane of L*a*b* color space. Chroma differences are (very) approximately the distance between the Reference and Camera values. (This difference is ΔCab. The more complex ΔC94 and ΔC00 (CIEDE 2000) equations (described here) are more accurate. If a color correction matrix has been calculated, the corrected values will be displayed.
|
 |
|
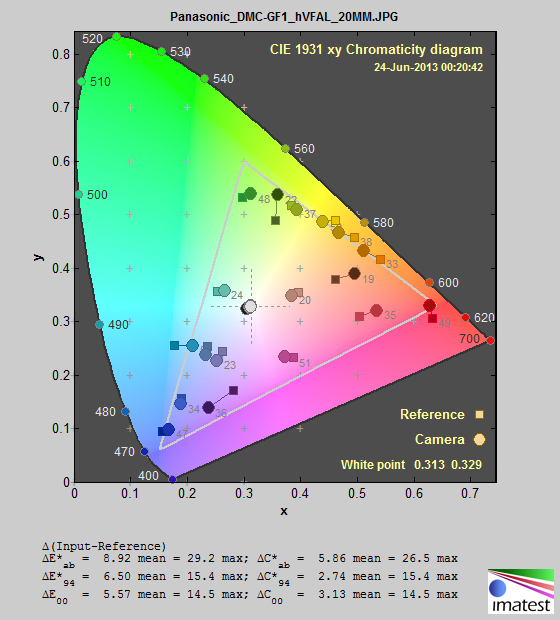
4. xy ChromaticityThis plot is familiar, but less perceptually uniform than the a*b* plot, above. Green gets too much area in this plot. If a color correction matrix has been calculated, the corrected values will be displayed. |
 |
|
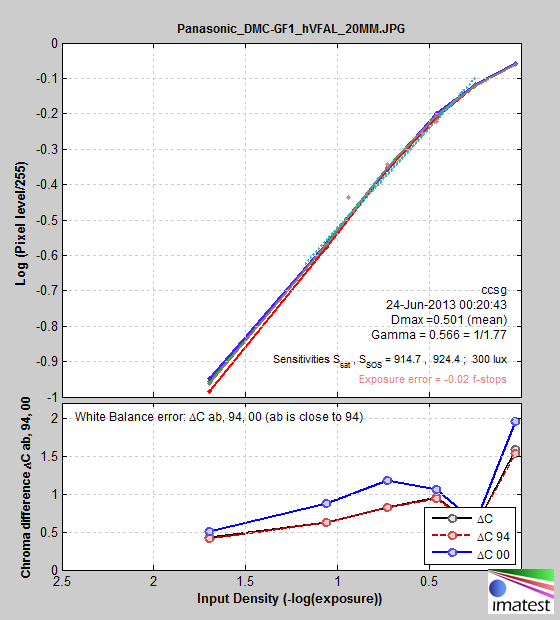
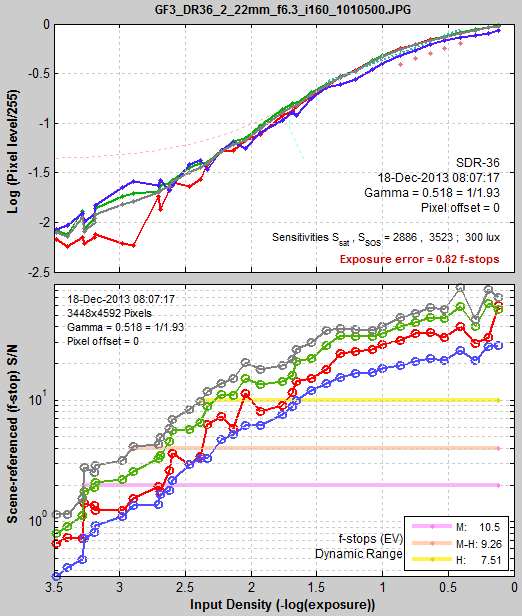
5. B&W Density & White BalanceThe Upper plot displays Log(Pixel level/255) (maximum of 1) vs. input density (-log10(exposure)), i.e., uses density units. The lower plot displays several types of ΔC as a function of patch density. See Colorcheck appendix. If a color correction matrix has been calculated, the corrected values will be displayed. |
 |
|
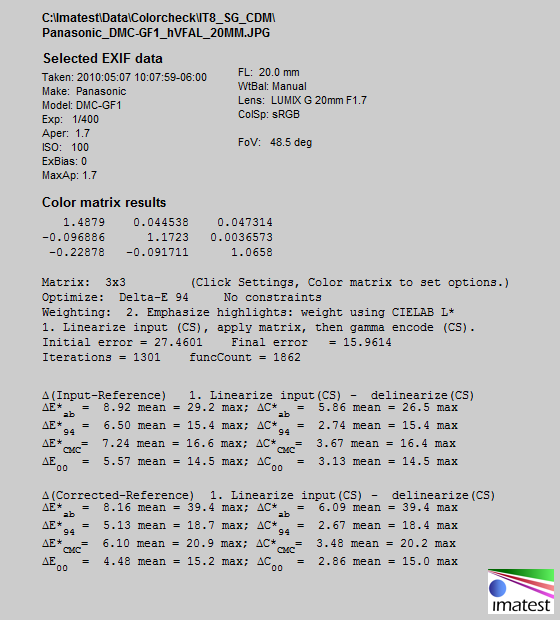
6. EXIF data and Color MatrixThis figure shows selected EXIF data and the results of the Color matrix correction, including
|
 |
|
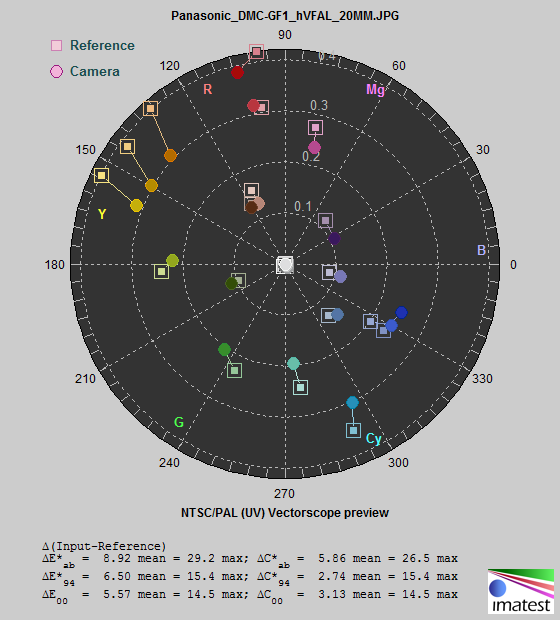
7. Additional 2D color plotsThe vectorscope display is shown. One of several plots can be selected here:
These displays are described in Using Color/Tone – Displays and Options. |
 |
|
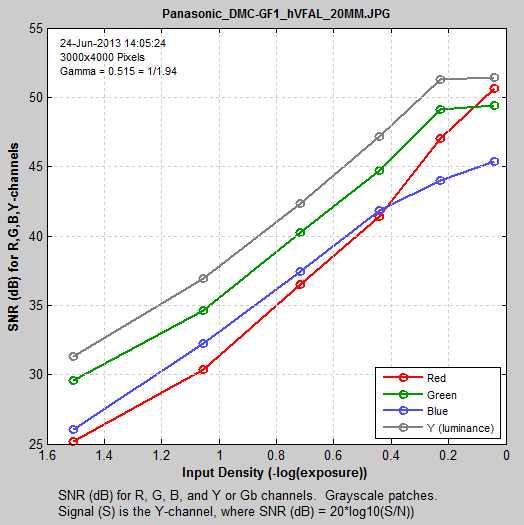
Noise/SNR analysis (not for all charts)The Noise/SNR analysis is only available on charts that have patches large enough to provide good noise statistics. Noise analysis includes standard pixel noise, chroma noise, scene-referenced noise, sensor (raw) noise, and ISO-15739 visual noise. SNR (Signal-to-Noise Ratio) can also be displayed as a ratio or in dB. The patches on the ColorChecker SG shown on this page are too small, but fortunately the Imaging-Resource image has a standard 24-patch ColorChecker to the left of the SG that we’ve analyzed to provide the results shown on the right. Noise analysis is described in Color/Tone and eSFR ISO Noise. ISO 15739 visual noise was added in Imatest 4.0. The following selections are available.
|
  |
 3D Color difference detail,
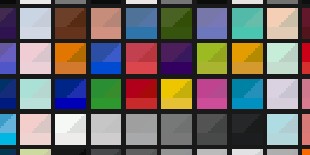
Imatest IT (Industrial Testing) settings
Imatest IT is the non-GUI version of Imatest fixed (auto) programs designed to be controlled by external programs. It consists of several discrete modules. It can be used for Pass/Fail analysis (Pass/Fail results can be previewed in Master with the Pass/Fail Monitor).
We generally recommend testing Imatest IT functionality with fixed (non-interactive) modules in Imatest Master, then saving appropriate sections of the INI file for use with IT. The typical sequence is
- Run a sample image in Color/Tone Interactive, making sure the displays and other settings are giving you the results you expect.
- Run the image in Color/Tone Auto to make sure all in INI file settings (several in the [gamut section, listed below) are correct.
- Extract the key sections of the ini file: [gamut] and the section corresponding to the chart type (for example, [sdr-36], [cc24], as described below), along with other sections recommended for all IT analysis: [imatest], … See the Configure INI file section in any of several IT pages.
- To obtain detailed information about the key INI file settings, open the INI File Monitor before running Color/Tone Interactive or Auto. See the Appendix, below for details.
INI file sections are denoted by [section_name] in brackets. Two sections are required for Color/Tone runs.
- [gamut] contains general (global) Color/Tone settings. Historical note: Multitest is the former name for Color/Tone Auto. It has been kept for parameter names for backwards compatibility.
- Sections for individual chart types, for example, [sdr-36] for 36-patch Dynamic Range charts and [cc24] for the 24-patch Colorchecker (Classic, etc.).
We will list some of the key ini file settings below. (We hope to incorporate them into a separate page, similar to the pages listed after the Imatest INI File Reference.
| Parameter | Settings window |
Typical values [default] |
Description |
| [gamut] Important ini file settings will be shown first |
|||
|
chartClassMultitest |
Set in several places: the Color/Tone dropdown menu or the button in the Imatest main window or in the Chart type dropdown menu in the Color/Tone Auto settings window. | 1-3 |
Chart class for Color/Tone Auto. 1: Color charts; 2: Grayscale charts (multi-row); 3: Linear grayscale charts. Set when Color/Tone Auto chart type is selected. |
| chartMultitest | Set in same locations as chartClassMultitest (if 1) See Color/Tone dropdown (above). |
Most common: 1, 2, 4, 5, 11, 13, 14, 16 |
Determines (color) chart type for Color/Tone Auto when chartClassMultitest = 1. {‘1. Colorchecker-24’; ‘2. IT8.7’; ‘3. QPcard’; ‘4. Colorchecker SG’; ‘5. ChromaDuMonde 28’; ‘6. SFRplus 20-patch’; ‘7. UTT’; ‘8. SpyderCHECKR’; ‘9. SMPTE/Hale bars’; ’10. TE226′; ’11. General m x n’; ’12. DreamCatcher 48′; ’13. ColorGauge 6×5′; ’14. RezChecker 6×7′; ’15. CMP DT003′; ’16. eSFR ISO color & grayscale’; ’17. ISO 16505 color’} Some are obsolete (3, 9, 12, 15) or rarely used. |
| altchartMultitest | Set in same locations as chartClassMultitest (if 2) See Color/Tone dropdown (above). | Most common: 1, 4, 6, 10, 11, 13 |
Determines (grayscale) chart type when chartClassMultitest = 2. {‘1. ISO 14524’; ‘2. QA-61’; ‘3. QA-62’; ‘4. ISO 15739’; ‘5. EIA Grayscale’; ‘6. OECF 20-patch’; ‘7. Squares in circle’; ‘8. ITE Grayscale’; ‘9. QA-79′; ’10. General m x n’; ’11. 36-patch Dyn Rng’; ’12. SFRplus grayscale’; ’13. Contrast-Resolution’; ’14. TE269′} |
|
progm sectini |
Set when chart (module) type is selected. | sdr-36, cc24, etc. |
progm is the recently-run program. May not be needed for IT. sectini is the INI file section name (inside brackets) for the individual program settings. Settings should be synchronized with chartMultitest or altchartMultitest. For chartclassMultitest = 1 (color charts): For chartclassMultitest = 2 (grayscale charts): |
|
multitest_name |
Set when chart (module) type is selected. |
This setting may be redundant, but it should be entered to be sure settings are all OK. It should be synchronized with the first three settings, above. Use the text shown above for chartMultitest and altchartMultitest (without the number at the beginning). |
|
|
|
|||
| chartClass (for Color/Tone Interactive) |
Similar to chartClassMultitest, but applies to Color/Tone Interactive. Set in the Color/Tone Interactive dropdown menu. | 1-3 | 1: Color charts; 2: Grayscale charts (multi-row); 3: Linear grayscale charts. Set when Color/Tone Interactive chart type is selected. (Not for IT) |
| chartype | Determines (color) chart type for Color/Tone Interactive when chartClass = 1. Same numbers as chartMultitest. (Not for IT) | ||
| altchartype | Determines (grayscale) chart type for Color/Tone Interactive when chartClass = 2. Same numbers as altchartMultitest. (Not for IT) | ||
Appendix: INI File Monitor
The full description (recommended) is on INI File Reference — INI File Monitor. Here are the quick instructions.
- Prior to running Color/Tone Interactive or Auto, open the INI File Monitor from the INI File dropdown menu or the tab area on the right. This opens the INI File Monitor window shown in the INI File Reference, which can stay open in the background as long as needed.
- Run Color/Tone Interactive or Auto as usual.
- In the INI File Monitor window, click Open the INI File Reference with the current data . This opens a long web page, a portion of which is shown below. The page displays current settings and has explanations for most of the entries.
|
INI file settings for Color/Tone Auto (Multitest) sdr-36 For more information on how to use INI files in Imatest IT, we recommend the Imatest INI File Reference. See also Saved settings – Imatest.ini and INI files for use with Imatest IT For Imatest IT, many of the entries in the table don’t need to be entered because they don’t affect Imatest IT results: they control interactive figure displays or figure output formats (figures are often not used in Imatest IT). Some have extra (unused) values to facilitate future expansion. To extract an INI control file for Imatest IT from the default Imatest Master INI file (imatest-v2.ini), we recommend the procedure described in Extracting an INI file from imatest-v2.ini for Imatest IT. In Imatest 5.2+, Multitest has been renamed Color/Tone Auto, but ‘Multitest’ will still be used in the ini file. Run Multitest with the chart to be used for IT prior to extracting the ini file from imatest-v2.ini (which contains everything from Master runs). This document was created by running Multitest sdr-36 in Imatest 22.1.0.b.1. BETA on 05-Apr-2022 11:13:00. (Color code table has been omitted.)
|
||||||||||||||||||||||||||||||||||||||||||||||||||||||||||||||||||||||||||||||||||||||||||||||||||||||||||||||