Analyses & Output – INI settings – Chart Definition Files – Chart Definition Utility
Combine all the features you need to analyze into a single chart
Introduction
The Imatest™ Arbitrary Charts module analyzes images of custom test charts. A chart-definition file (typically user defined) is needed to describe the chart layout to Imatest software. The Arbitrary Charts module will automatically locate and analyze target features when an observed image of a chart is loaded along with the corresponding definition file.
This module allows users to get a number of measurements out of custom, legacy, or competitors’ charts which are unsupported in other modules in Imatest, as long as they are composed of only a certain set of features (described below). It is available in both Imatest Master and Imatest IT.
Getting started
Arbitrary Charts Quickstart (Imatest Master)
|
Supported Target Features
The following set of features can be added to chart designs and analyzed with the Arbitrary Charts module. This is a growing list, with new features added with new software releases. See the Arbitrary Chart Definitions page to learn about the attributes for each feature.
|
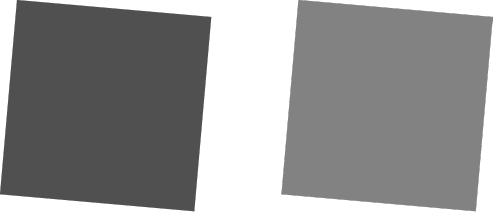
Slanted square features yield four slanted edges, each of which can be used to produce slanted-edge MTF results. |
 |
|
Individual slanted edge features. |
 |
| Registration marks, used for automatic registration of the chart design with the test image. |
 |
|
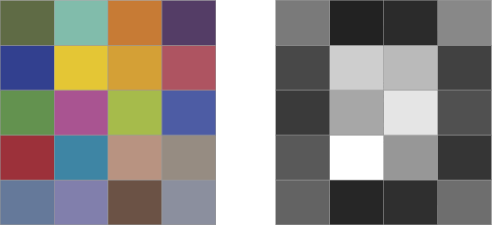
Color patch features (grayscale and chromatic) which can be used to measure color errors, tonal response, noise, and dynamic range. |
 |
|
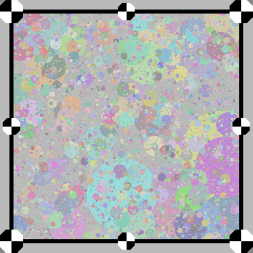
Random texture patch features which can be used to derive “Texture MTF” results. |
 |
Arbitrary Chart Definitions
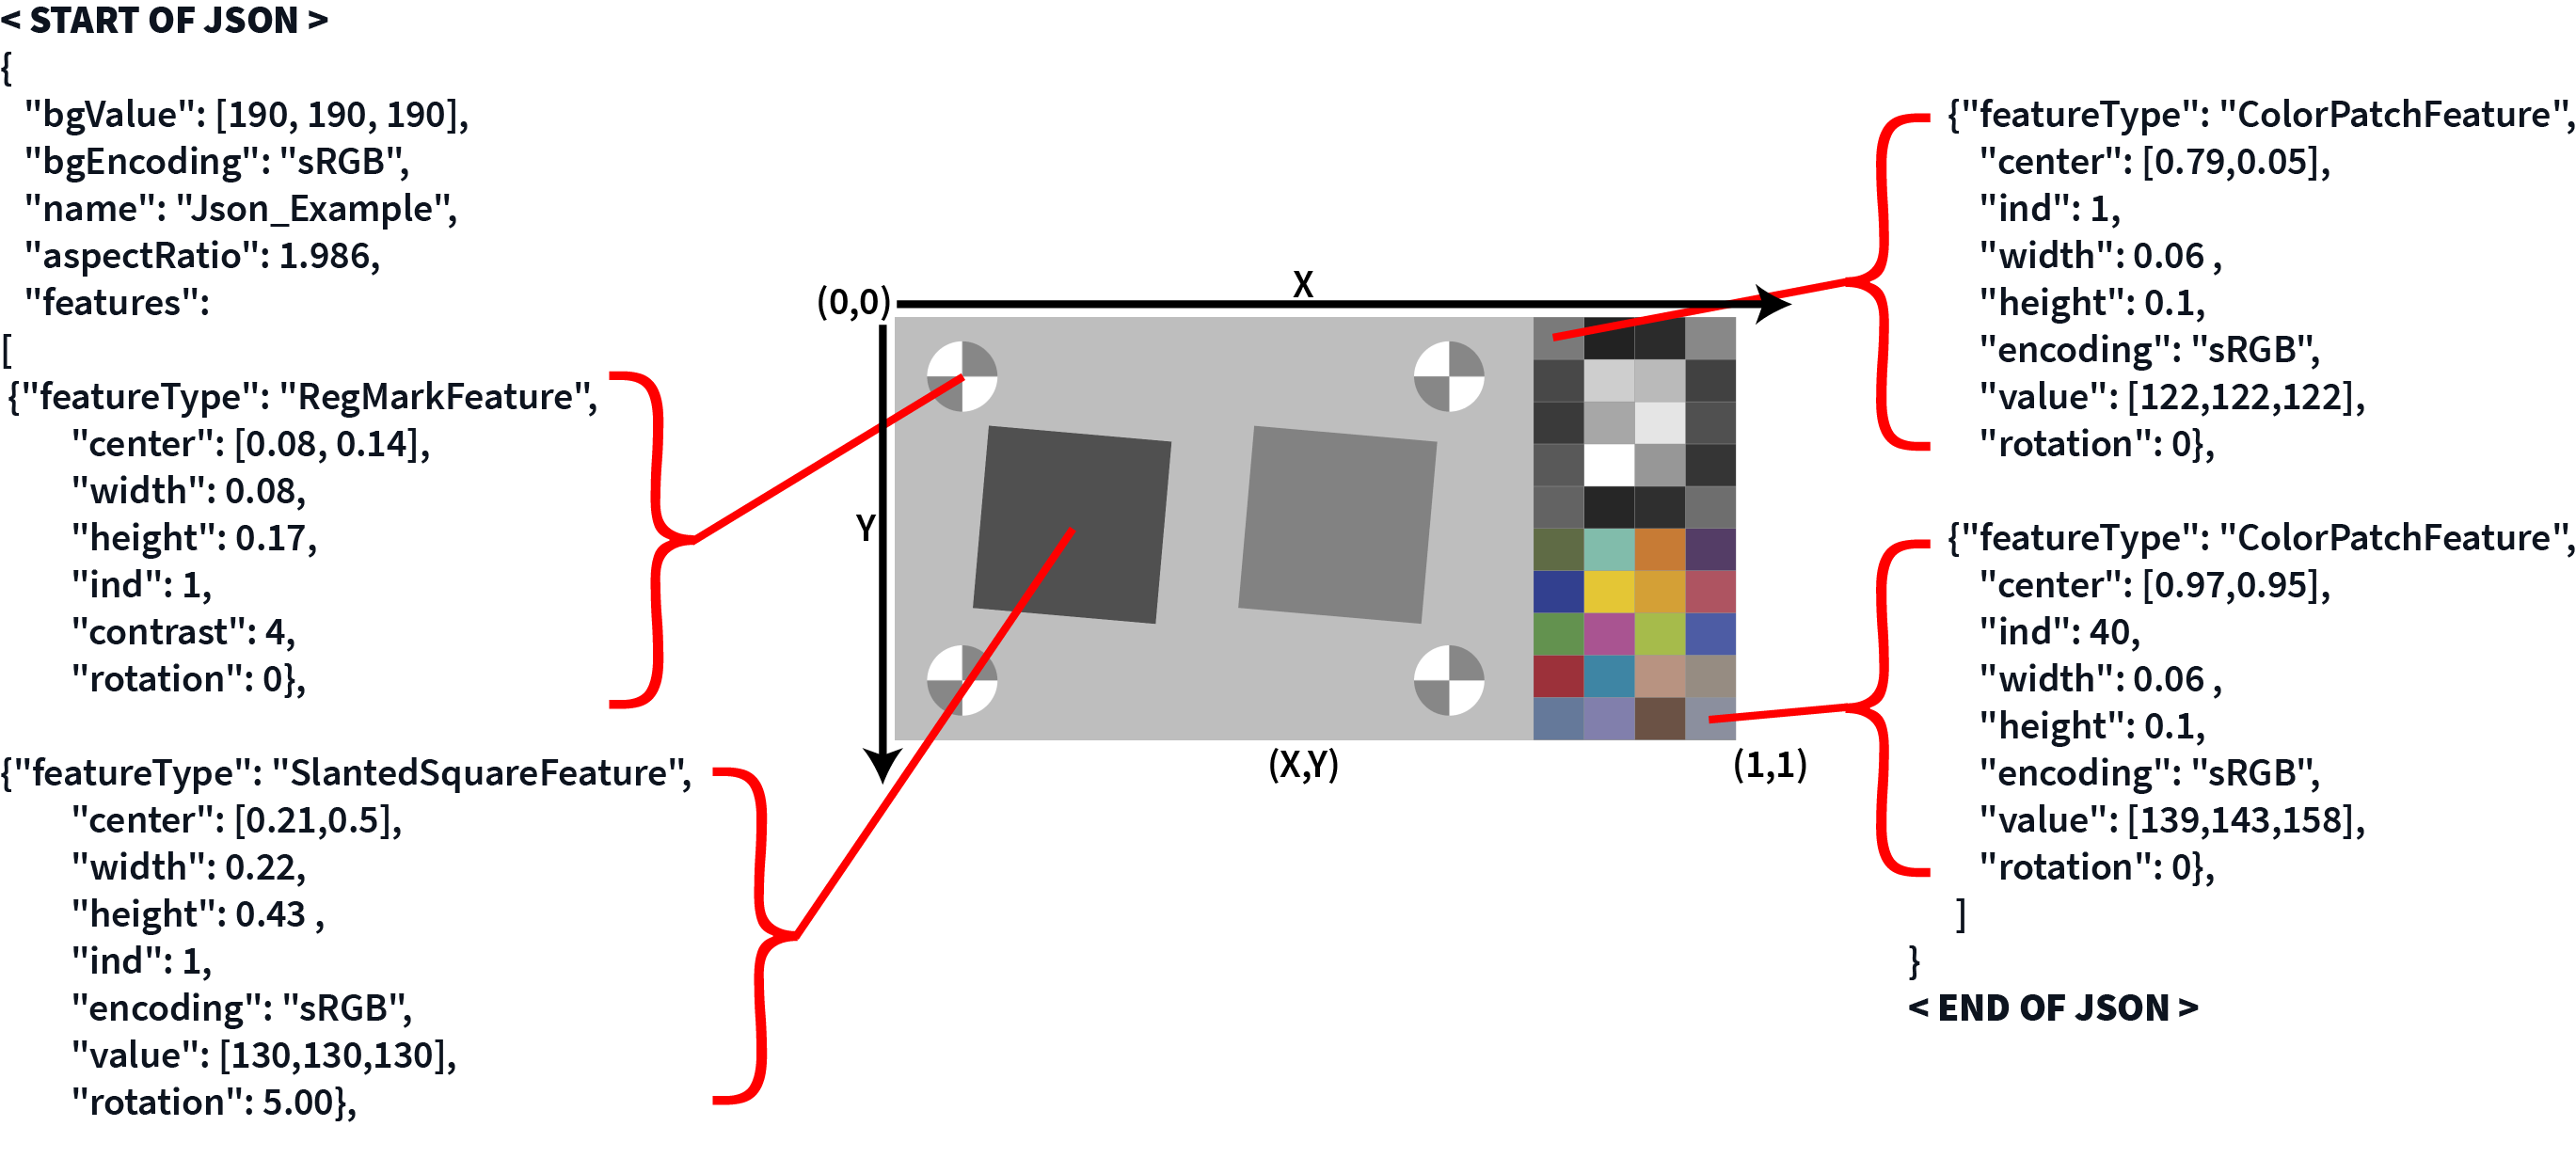
For Imatest to automatically locate and analyze target chart features in an image, the layout and reference values of a chart must be defined by a chart definition file. These files indicate the relative locations of features and important information about them for analysis, such as the expected color of a color patch area. They are dependent upon both the layout of features you want to analyze and the medium the chart is produced on. Below is an illustration of how this JSON-structured, plain-text file describes the features and their layout.

We encourage users to design their own chart layouts consisting of combinations of the above features as suits their needs. Currently, the creation of these designs is a manual process and there are no integrated tools in Imatest for doing so. However, the Chart Definition Utility GUI in Imatest Master can aid in the verification of correctness of chart definition files.
Contact support@imatest.com if you need further assistance in producing a chart design.
Once you have created your own chart design, both a graphic version and chart definition file, contact charts@imatest.com for precision fabrication of the design on a number of different substrate media.
The Arbitrary Charts module is an area of active development- it works differently from most other modules in Imatest in a number of ways. We are working on adding every capability of Imatest to this module, but below is a current list of known limitations. These apply to both Master and IT.
- Three-channel, color image data will be assumed to be sRGB only, no other color space. One channel data is analyzed as Intensity information- i.e. no allowances for color-filter-array information yet.
- Input images in a batch run must be all the same type of data encoding (sRGB or Intensity).
- Only the Random Direct analysis method is available on “Random Texture” features, even features marked with the appropriate RandomType as being “cross” features.
- Alignment and auto-ROI-determination limitations:
- Only Automatic registration is supported, even in Imatest Master. In Imatest Master, users can be prompted to confirm and accept the alignment that was found, but cannot manually adjust it.
- Only relatively low amounts of geometric distortion can be tolerated.
- The chart must be oriented at least roughly correctly in the image, i.e. centered in the center of the image and with the upper left corner of the chart as it is implicitly defined by the chart definition file.