Analyses & Output – INI settings – Chart Definition Files – Chart Definition Utility
Data outputs from the Arbitrary Charts Module are different from other modules in Imatest.
- Only JSON files are output, no CSV or XML.
- The structure of the JSON is substantially different than other modules.
- If many images are run in a batch, the results from all images may be contained in a single JSON.
Since the Arbitrary Charts Module is based on the concept of custom layout of features, there is no fixed structure to the measurement results which it produces. Instead, the module simply produces results based on whatever it observes in the test image(s). The set of results produced depends on the set available for that type of feature (outlined below) and user options for enabling or disabling each analysis type.
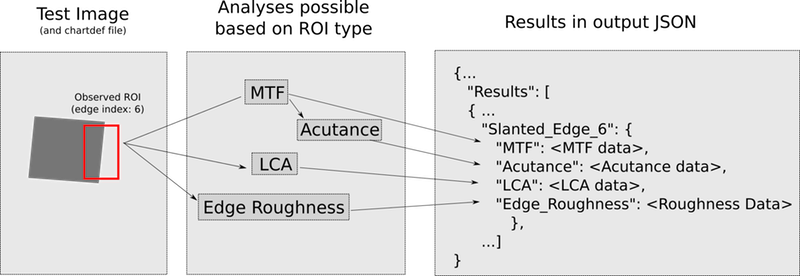
Example: Slanted Edge ROI outputs
If Imatest observes a slanted edge (based on a SlantedEdgeFeature or from one side of a SlantedSquareFeature) in a test image, it will produce all of the results that can be calculated from a slanted edge, such as MTF (and from this, acutance), chromatic aberration, edge roughness, etc. (If each of these has been requested for calculation in the user options, that is. By default, they typically are.)
All of these results will then be grouped in the output JSON under a field entry named “Slanted_Edge_N”, where N is the unique index of the edge (more on this below). Each result based on this observed edge will be have its own entry, as seen in the diagram below.
ROI results vs System results
Very roughly speaking, Imatest offers some measurements based specifically on a single ROI and some measurements which tell you about the whole “system” based on multiple ROI.
For example, all the various results related to observing a single slanted edge (see the above figure) are ROI results while a geometric distortion result — which is based on many observed points around the entire image plane — would be a System result.
- Only one of each system result is produced per test image
- An ROI result is generated for each instance of the corresponding ROI type
Sometimes, a system result will contain an array of per-ROI results, with the relevant measurements gathered in these sub-results. This is very typical of grayscale- and color-patch features, which are used to generate measurements of noise, tonal response, color accuracy, etc. Though Imatest could give all such results individually for each patch at the top level, they are more usefully when offered in the context of the system result.
Per-ROI Result Indexing
Per-ROI results are reported in a JSON object located under a field labeled “<ROI TYPE>_N”, where N is the unique index value which identifies each ROI of a given type. (For example: “Random_Field_1”.) These indices correspond directly to the “ind” value entry defining each feature in the chart definition file.
To relate entries found in the Arbitrary Results JSON to specific features on the chart, cross-reference with the chart definition file. (Hint: The Chart Definition Utility can be useful for this, if you choose to show feature indices.)
Slanted Edge Indexing
Slanted edge ROI indexing extends the above rule. This is necessary because:
- there are two ways to create a slanted edge ROI on a chart (SlantedEdgeFeature and SlantedSquareFeature), and
- each SlantedSquareFeature implies four slanted edge ROIs, but itself only has only a single index.
The extended indexing rule for slanted edges is as follows (and is illustrated below):
- If there are S many SlantedEdgeFeatures defined on the chart, the first S indexed results correspond to those. (Note that S is simply 0 for charts that don’t have any SlantedEdgeFeatures defined, so any slanted-square-derived edges will start at index 1.)
- Every SlantedSquareFeature adds four edge indices to the list in the order of top, right, bottom, left edge. The order in which these are added is based on the index of the SlantedSquareFeatures.
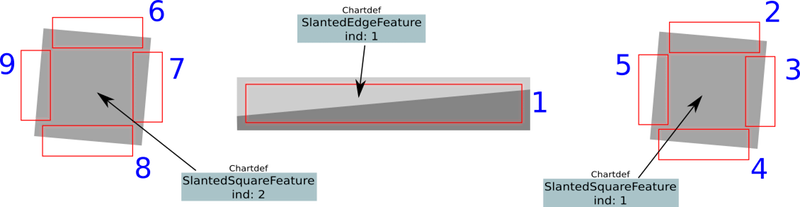
Edge ROI, outlined in red, have unique and consistent identifying indices, in blue. These are based on the chart definition file only, not position in the test image (or whether or not they appear in the image at all).
Result JSON structure
JSON outputs from the Arbitrary Charts Module have the following hierarchical structure.
Top-level object (with fields) ;
Info (Object containing fields with information about the run time, Imatest version, etc)
Results_array_sources (array of strings naming the image sources which were used to generate the following array of results)
Results (array of objects, one per entry in Results_array_sources)
The Results entry of the top level JSON object is an array, each entry of which contains the measurements taken from an image. The ordering of the string entries to Results_array_sources indicates the ordering of the source images which produced the results-bearing-objects in the array contained in Results.
Note: Even in the case of a module run on a single image, the Results and Results_array_sources fields each contain a 1-element array containing their respective entries. This makes the JSON structure more consistent and predictable for simple machine parsing.
Following is a listing of the hierarchical structure of the objects in the Results array. Below, we use the notation that text in bold indicates a JSON object, and the “[… something_n …]” construct indicates an array of objects each indexed by different values of n (typically relating to chart feature indices as described above). Standard text indicates a field in an object.
(Note: The following information about output JSONs indicates the structure as of the latest release of Imatest. Exact object names and organization may be slightly different in previous versions.)
Per-ROI Outputs
Slanted Edges
[ …
Slanted_Edge_n
ROI
Top_left
width
height
Edge_Properties
orientation
angle
dark_mean
light_mean
dark_mean_lin_norm
light_mean_lin_norm
MTF
mtf
freqs
mtf50
oversharpening_percent
Acutance
acutance
CPIQ_QL
LCA
area_pixels
area_percent
cross_pixels
cross_percent
R_G_delta_pixels
R_G_delta_percent
B_G_delta_pixels
B_G_delta_percent
… ]
Dead Leaves/Spilled Coins Patterns
[ …
Random_Field_n
ROI
Top_left
width
height
Random_Direct
freqs
mtf
texture_psd
noise_psd
Acutance
acutance
CPIQ_QL
… ]
System Outputs
Color
Patch_Colors
[ …
patch_n :
measured_RGB
measured_LAB
reference_LAB
Delta_C
Delta_E
Delta_C_94
Delta_E_94
Delta_C_2000
Delta_E_2000
… ]
Max_Color_Errors
Delta_C
Delta_E
Delta_C_94
Delta_E_94
Delta_C_2000
Delta_E_2000
CPIQ_Color_Saturation
CPIQ_color_OM
CPIQ_color_QL
System_LCA
rg_fit_coeffs
bg_fit_coeffs
rg_delta_pixels
bg_delta_pixels
CPIQ_pixels
CPIQ_metric
CPIQ_QL
Tonal_Analysis
reference_y
measured_y
measured_luma
fit_gamma
exposure_err_fstops
Noise
ISOsnr
saturationLum
CPIQ_visual_noise_OM
CPIQ_visual_noise_QL
[ …
patch_n
luma_std
r_std
g_std
b_std
Lstar_std
astar_std
bstar_std
sceneRefNoise
sceneRefSNR
CPIQ_Visual_Noise
visual_noise
mean_L
mean_a
mean_b
var_L
var_a
var_b
covLa
ISO_Visual_Noise
visual_noise
mean_L
mean_u
mean_v
sigma_L
sigma_u
sigma_v
… ]
Uniformity_Grid
*selected channel*_Grid (note: there may be multiple selected uniformity grid channels, each will have an entry)
*selected color error*_deltaC (note: there may be multiple selected uniformity grid color errors, each will have two entries)
*selected color error*_deltaE
CPIQ_Results
Color_Uniformity
OM
QL
Output File Name and Location
Output file names are formatted as:
<chart name>-<test image name>.json, if the INI field [arbcharts] combineOutput is 0 (see settings page) or:
<chart name>-batch-<timestamp>.json, if [arbcharts] combineOutput is 1.
where:
- <chart name> is the entry of name field of the chart definition file used during the module run.
- <test image name> is the test image file name, including the full extension (e.g. “test_image_5.jpg”).
- <timestamp> is a time stamp of the starting time of analysis (safe for a filename on all systems as per ISO 8601), of the form ‘yyyymmddTHHMMSS’.
The default location for the output files from this module is a “Results” subfolder of the user’s home directory. Output may be redirected to a location of the user’s choice by entering a valid path into the Arbitrary Charts GUI window’s “Output save directory” field (or equivalently by entering a valid path string in the [arbcharts] save_dir_name entry of the INI file). This path must both exist and allow writing to disk under the current user’s privileges. Doing so will force the creation of the Results subfolder there upon future runs, instead.