This post addresses concerns about the sensitivity of slanted-edge patterns to signal processing, especially sharpening, and corrects the misconception that sinusoidal patterns, such as the Siemens star (included in the ISO 12233:2014 standard), are insensitive to sharpening, and hence provide more robust and stable MTF measurements.
|
April 2024. We have a new document that compares slanted-edges with Siemens stars. (I’m embarrassed to say I’d forgotten the existence of this post.) Slanted edge vs. Siemens star MTF calculations: 2024 white paper We compared images (simulated, JPEG, and raw; demosaiced and one undemosaiced) that contained a Siemens star and slanted edges. We found some interesting effects of demosaicing and concluded that both chart types may be required to fully characterize cameras that have low quality demosaicing and/or strong bilateral filtering (which sharpens edges but lowpass-filters smooth areas.) For most purposes, we prefer the slanted edge. |
To summarize our results, we found that the Siemens Star (and other sinusoidal patterns) are nearly as sensitive as slanted-edges to sharpening, and that slanted-edges give reliable MTF measurements that correspond to the human eye’s perception of sharpness.
The relatively high contrast of the Siemens Star (specified as >50:1 in the ISO standard) makes measurement results somewhat sensitive to clipping and nonlinearities in tonal response. Low contrast slanted-edges (4:1 in the ISO standard) closely approximate features our eyes use to perceive sharpness, and they rarely saturate images. Measurements based on slanted-edges accurately represent real-world performance and are well suited for testing of cameras in wide range of applications, from product development to manufacturing.
Full details of the comparison are in the Slanted-Edge versus Siemens Star and the Slanted-Edge versus Siemens Star, Part 2 pages, where we compare MTF calculation results from slanted-edge patterns, which are performed by Imatest SFR, SFRplus, and eSFR ISO, to results from sinusoidal patterns, which are performed by the Imatest Star chart (for the Siemens star) and Log F-Contrast modules, paying special attention to the effects of signal processing, especially sharpening and noise reduction (which are performed by software or in-camera firmware).
Most consumer cameras sharpen images in the presence of contrasty features (like edges) and reduce noise (lowpass filtering; the opposite of sharpening) in their absence. The details of this processing are more complex, or course, and vary greatly for different cameras. For this reason we tested six cameras. The primary example is a camera whose image sensor and pixel size is between that of camera phones and DSLRs: the Panasonic Lumix LX7 (a high-end point-and-shoot with an excellent Leica zoom lens and optional raw output). We also analyze a camera phone with excessive sharpening and four additional cameras.
Raw results
Quick summary: Raw MTF results are nearly independent of chart type, contrast level, and ISO speed.
|
Raw images were converted to demosaiced TIFF files using dcraw, which applies no sharpening or noise reduction. Output gamma was set to 1.0 (Linear; i.e., no encoding gamma). No signal processing was applied apart from demosaicing. The converted raw images can be considered to be “original” unprocessed images. In comparing raw results from slanted edges of varying contrast (2:1, 4:1, and 10:1) with images of the Log F-Contrast and Siemens Star charts, we found that raw results are nearly independent of chart type, contrast level, and ISO speed. |
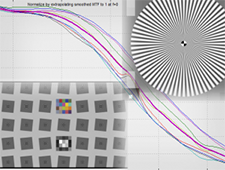
 Raw image @ ISO 80; >10:1 edge Raw image @ ISO 80; >10:1 edge |
The monotonically-decreasing shape of the MTF curve (clearer on the less noisy image on the left) is characteristic of unsharpened images. Sharpened images have a characteristic boost in the middle frequencies (around half the Nyquist frequency) described in more detail here. We will use this curve for comparison with sharpened images, below.
Slanted-edge results
|
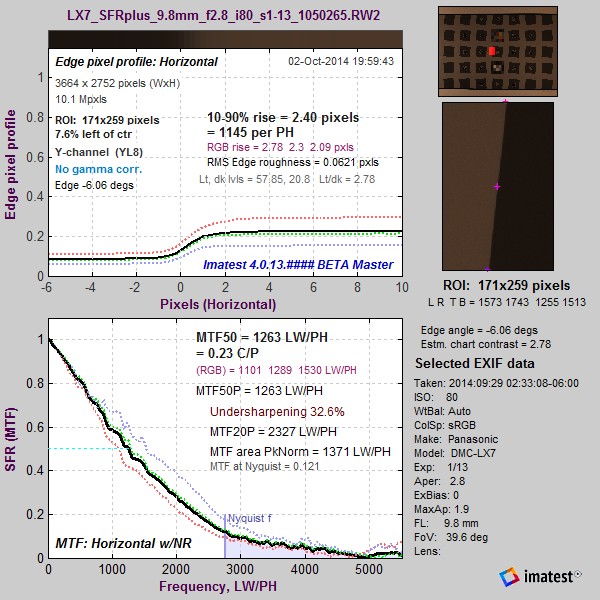
The image on the right is typical of how slanted-edges are affected by signal processing, especially sharpening, which is performed by software/firmware in the camera. The rise distance is shorter; over and undershoots are visible on the edge, and the MTF curve has a peak (reaching 1.2) around Nyquist/3– typical of moderately strong sharpening. The image on the right with 4:1 contrast has MTF50 = 0.412 Cycles/Pixel (C/P). For 2:1 contrast, this drops to MTF50 = 0.376 C/P. For 10:1 contrast it increases to 0.481 C/P. Note that the ratio between the light and dark regions is reduced in the JPEG image (compared to the raw image, above) because an encoding gamma has been applied. |
 Camera JPEG @ ISO 80; 4:1 edge. Camera JPEG @ ISO 80; 4:1 edge. |
This is typical of consumer cameras, which tend to have more sharpening near contrasty features and less sharpening (often none at all, or noise reduction (lowpass filtering)— which is the inverse of sharpening) in the absence of contrasty features. The sharpening boost is very clear for slanted-edges (and indeed represents what happens to edges in real world images). Next we look at sharpening in sinusoidal images (Log F-Contrast and the Siemens Star).
Sinusoidal (Log F-Contrast and Siemens star) results
Both the Log F-Contrast chart and the Siemens Star have sinusoidal patterns, and hence have similar MTF response characteristics (at similar contrast levels). The key differences:
- The Log F-Contrast measures MTF in a single direction (horizontal), but has a range of contrast levels.
- The Siemens Star measures MTF in multiple directions, but has a single (high) contrast level (specified as > 50:1 ISO 12233:2014).
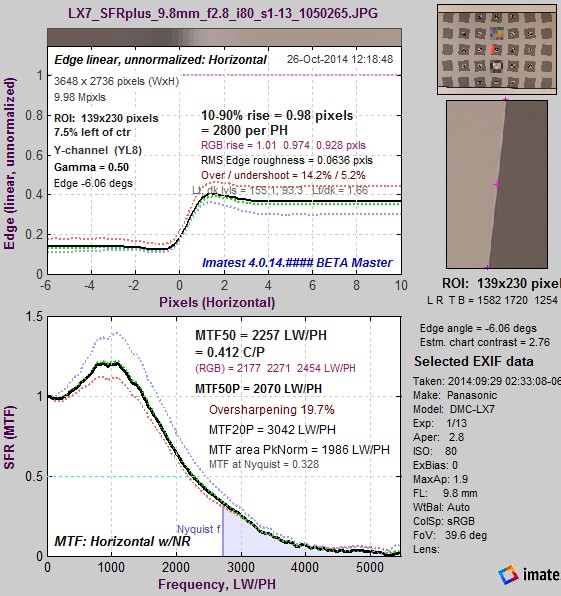
 MTF for Log F-Contrast, rows 1-19 in steps of 3 (of 25), Camera JPEG @ ISO 80 |
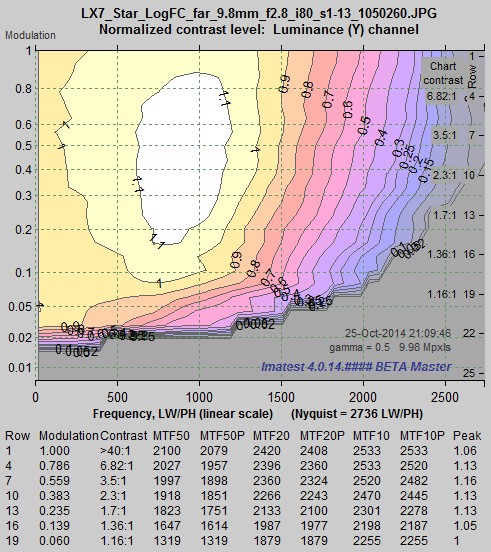 MTF contours for Log F-Contrast image, Camera JPEG @ ISO 80 |
The two plots (above) display the same MTF results for the Log F-Contrast chart in two different formats: actual MTF curves (above left) and MTF contour plots (above right). The contour plots are clearer for observing the change in response with contrast, but the MTF curves are better for comparing with the Siemens Star chart results on the right. Sharpening is present in rows with modulation levels greater than 0.1. it drops very rapidly for modulation below 0.1: it’s mostly gone by Row 19 (modulation = 0.06).
|
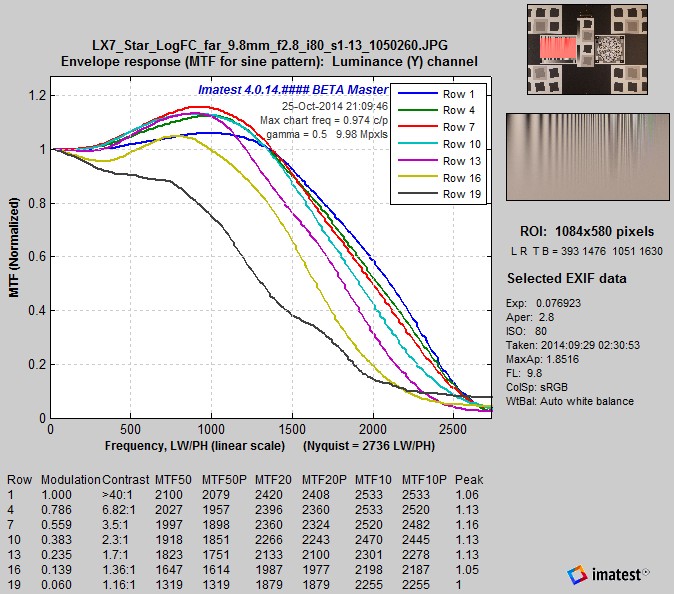
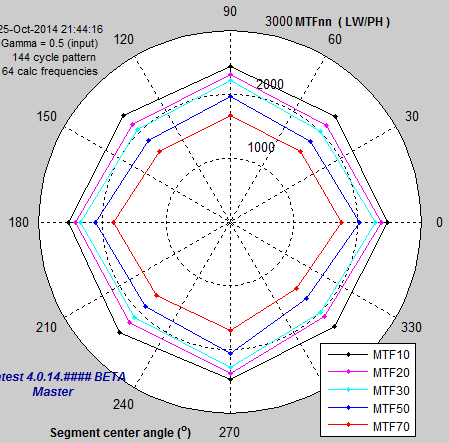
The Siemens Star chart MTF results are extremely close to the Log F-Contrast results for Row 1 (the highest contrast), particularly when the Horizontal and Vertical MTFs are considered. (Diagonal MTF50 is slightly lower than H and V.)
|
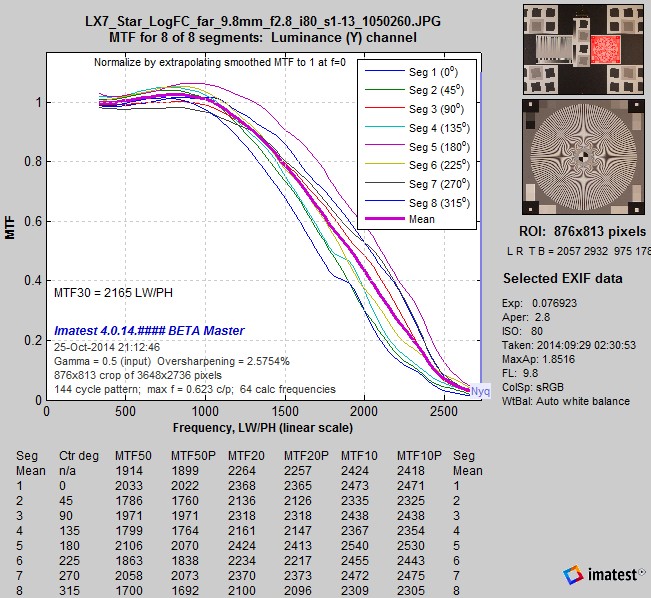 MTF for the Siemens Star chart, Camera JPEG @ ISO 80. MTF for the Siemens Star chart, Camera JPEG @ ISO 80. |
These results show that a significant amount of sharpening is present for high contrast sinusoidal patterns.
A camera phone with extreme sharpening
In early 2013 we received images from a camera phone that had an extreme— and highly atypical— amount of sharpening. We described the results of testing this image in Dead Leaves measurement issue. We did not receive a Siemens star image, but, as we have shown in Slanted-Edge versus Siemens Star, the response of Row 1 of the sinusoidal Log F-Contrast chart should be very close to the response of the (high contrast) Siemens Star. Here are the Log F-Contrast results.
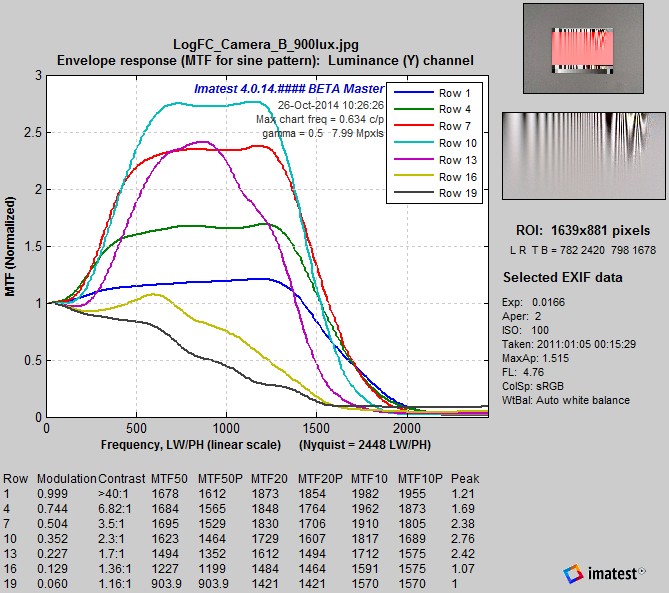 MTF for extremely sharpened image: MTF for extremely sharpened image:Log F-Contrast, rows 1-19 in steps of 3 (of 25), Camera JPEG @ ISO 80 |
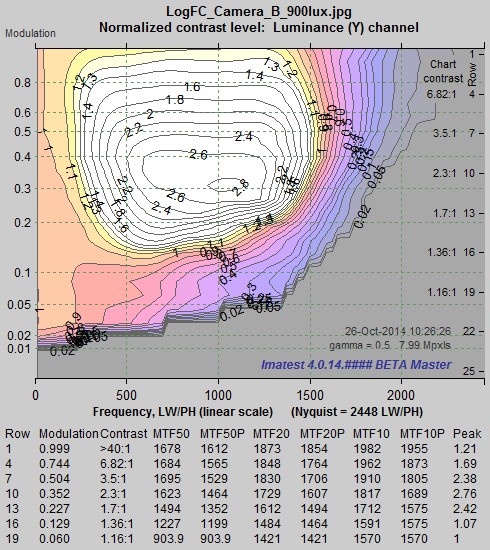 MTF contours for extremely sharpened image: MTF contours for extremely sharpened image:Log F-Contrast, Camera JPEG @ ISO 80 |
For this camera, the MTF of the sinusoidal Log F-Contrast chart (whose response for the high contrast rows near the top should be similar to the Siemens Star pattern) is remarkably sensitive to sharpening— more than expected. The maximum peak response of 2.8 was for modulation = 0.3 (approximately 2:1 contrast). For higher contrast levels (rows 1-10) sharpening causes the Log F-Contrast chart to saturate, i.e., clip (go to pure white). This saturation is visible in the flat tops of the MTF curves (above-left) and in a crop of the image in the Slanted-Edge versus Siemens Star documentation page.
|
The results on the right show extreme sharpening for the slanted-edge (located just below the Spilled Coins pattern), highly visible in the edge in the region crop on the right. Surprisingly, the sharpening is about equal to the strongest sharpening for the Log F-Contrast chart (around row 11), shown above. Another surprise: the slanted-edge doesn’t saturate (clip), though it comes very close: its sharpening “halo” (the positive peak in the upper, spatial plot) almost reaches clipping. For the low contrast slanted-edge, the MTF plot accurately represents the system performance (whereas the highly-saturated Log F-Contrast MTF curves are not a good representation). In cases like this we recommend failing this camera because of its excessive edge overshoot (85.6%) or MTF peak (2.8). Sharpening artifacts can be highly visible (and objectionable) when overshoot exceeds 30% or the MTF peak exceeds about 1.5. |
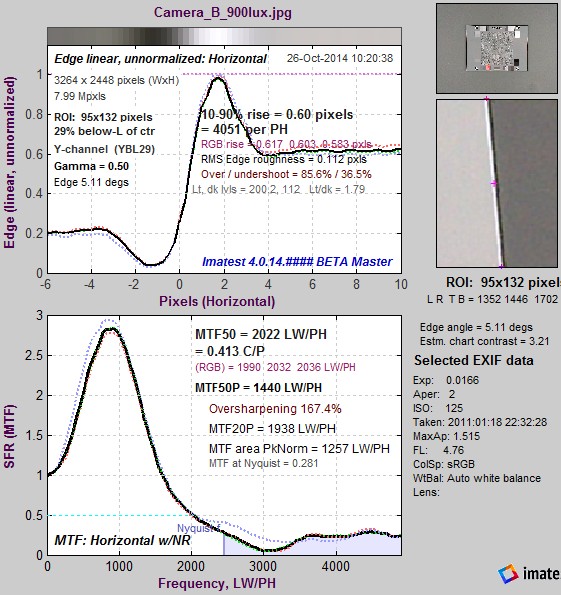 MTF for extremely sharpened image: MTF for extremely sharpened image:Slanted-edge (below the Spilled Coins pattern), Camera JPEG @ ISO 80 |
The Siemens Star, which has high contrast (>50:1; comparable to the top row of the Log F-Contrast chart), would have a lower MTF peak and a higher MTF50 for this camera because of strong saturation, not because it is less sensitive to signal processing. Measurements would look unrealistically good for this system, despite the severe (and highly visible) oversharpening.
Summary
Our perception of image sharpness is closely correlated to the appearance of edges (contrast boundaries) in the image. This is a key reason for the use of edges in MTF measurement (the slant makes the result insensitive to sampling phase). Saturation was often a problem with the edges in the old ISO 12233:2000 chart, which had a specified minimum contrast of 40:1 (80:1 or more was typical). This problem has been resolved in the new ISO 12233:2014 standard (released in February 2014; implemented in SFRplus and ISO 12233:2014 Edge SFR charts), which specified an edge contrast of 4:1. Not only are these edges unlikely to saturate, their contrast is similar to real-world features that affect our perception of sharpness. Measurements based on low-contrast slanted-edges accurately represent imaging system performance.
| Results from the six cameras we tested (two in Slanted-Edge vs. Siemens Star (Part 1) and four in Part 2) show that MTF results for both slanted-edges and Siemens stars (as well at other sinusoidal patterns) are sensitive to sharpening (and that there tends to be more sharpening for higher contrast features, although some cameras may reduce sharpening at the very highest contrast levels). We also found that the Siemens star was more affected by saturation and non-uniform signal processing in high contrast regions. Saturation tends to flatten the Siemens star MTF response— to reduce peak MTF, making it appear that it is less sensitive to sharpening, when in fact the MTF measurement is questionable. |
The sensitivity of slanted edges to sharpening is not a drawback because it is not excessive and it represents the way we perceive image sharpness.
| Advantages | Disadvantages | |
| Slanted- Edge |
More efficient use of space (allows a detailed map of sharpness over the image surface). Faster. Robust in the presence of optical distortion. |
Slightly more sensitive to software sharpening, depending on camera firmware. Measures only near-horizontal and vertical edges. |
| Siemens Star |
Slightly less sensitive to software sharpening. Measures MTF for a variety of angles (not just near-horizontal and vertical), though these measurements seem to be affected only by demosaicing and sharpening. |
Requires more space. Slower. Saturation in highly oversharpened images is not obvious from measurement results. |
Conclusions
| The slanted-edge pattern provides accurate and robust measurements. Its speed and efficient use of space (which allows detailed sharpness maps) makes it the best choice for measuring the performance of a wide variety of camera systems and applications, from product development to production testing. |