
Imaging-resource.com publishes images of the Imatest Log F-Contrast* chart in its excellent camera reviews. These images contain valuable information about camera quality— how sharpness and texture response are affected by image processing— but they need to be processed by Imatest to reveal the important information they contain.
*F is an abbreviation for Frequency in Log F-Contrast.
I was motivated to write this post by my curiosity about the 36-megapixel mirrorless full-frame interchangeable-lens Sony Alpha A7R and how its image quality compares to competitive cameras (as well as cameras I now own). A post on Imaging-Resource.com says,
“In our initial press briefing, Sony made quite a big deal about its new sharpening algorithms, designed to reduce what they call “outlines” — which we’ve called “halos” for some years now. The images shown in that briefing were certainly impressive, but it’s hard to judge when there’s no standard of comparison against other cameras shooting the same scenes under controlled conditions. We had to see how it did on our own standardized studio shots before we could pass final judgment.
We’ve now done just that, and have to say we’re pretty well blown away by what we saw. Check our Sony A7R review page for our initial image comparison analysis…”
I will compare objective measurements from Log F-Contrast chart images. These provide a useful quantitative supplement to Imaging-Resource’s subjective (but vital) camera comparisons that use still-life images, enabling us to accurately asses Sony’s claim of sharpening without “halos”, to examine how noise reduction affects fine detail, and to compare different types of cameras. I’ll report on cameras of particular interest to me as well as cameras that I own.
| Sony A7R | Intriguing because of its high resolution (36-megapixels), small size and light weight for a full-frame camera, and lack of mirror. Small pixel size (relative to total field) allows anti-aliasing filter to be eliminated. |
| Pentax D645 | Standard of comparison. Medium format. Large, heavy and relatively expensive. Known for excellent image quality. |
| Nikon D800 | Popular 36-megapixel full-frame DSLR. (A D800E image was not not available.) Heavier and larger than the A7R. |
| Canon EOS-6D | 20-megapixel DSLR. I own one. Makes excellent images using off-camera raw conversion. |
| Panasonic DMC-G3 | 16-megapixel mirrorless interchangeable camera with eye-level electronic viewer (which I appreciate because I can’t focus well on regular screens without reading glasses). |
| Panasonic DMC-LX7 | 10-megapixel high-end compact with Leica f/1.4 zoom lens. |
| Sony RX100 II | 20-megapixel high-end compact with Zeiss f/1.8 zoom lens. (Hits a sweet spot for size vs. quality) |
| Fuji XE-2 | 16-megapixel mirrorless interchangeable camera, eye-level electronic viewer, Fuji X-Trans sensor, which allows anti-aliasing filter to be eliminated. |
| Sigma DP1 Merrill | 14.8-megapixel compact camera with Foveon APS-C-size sensor. No Color Filter Array or anti-aliasing filter. Non-interchangeable prime lens. |
My quest may be familiar to many of you: a small lightweight camera that can produce images comparable to the large-format prints by Ansel Adams and Edward Weston that I saw at the George Eastman House when I was growing up in Rochester, NY. In a word, I’m looking for the holy grail— at an affordable price. A modest quest.
Imaging-Resource.com
Imaging-resource.com publishes outstanding camera reviews, indexed on their Camera Reviews page. To find the Log F-Contrast images, go to a review page (here for the Sony A7R), click on the Samples tab, then scroll down (about 3/4 of the way to the bottom for the A7R). Look for the Multi Target image. Click on a thumbnail taken at a low ISO speed to see the camera’s ultimate capability. Later you may want to load images taken at higher ISO speeds to see how signal processing changes the results (you’ll almost always see additional noise reduction that tends to reduce sharpness, especially in low-contrast regions). Here is an image Imaging Resource’s Multi Target, showing the Log F-Contrast chart just below the center.
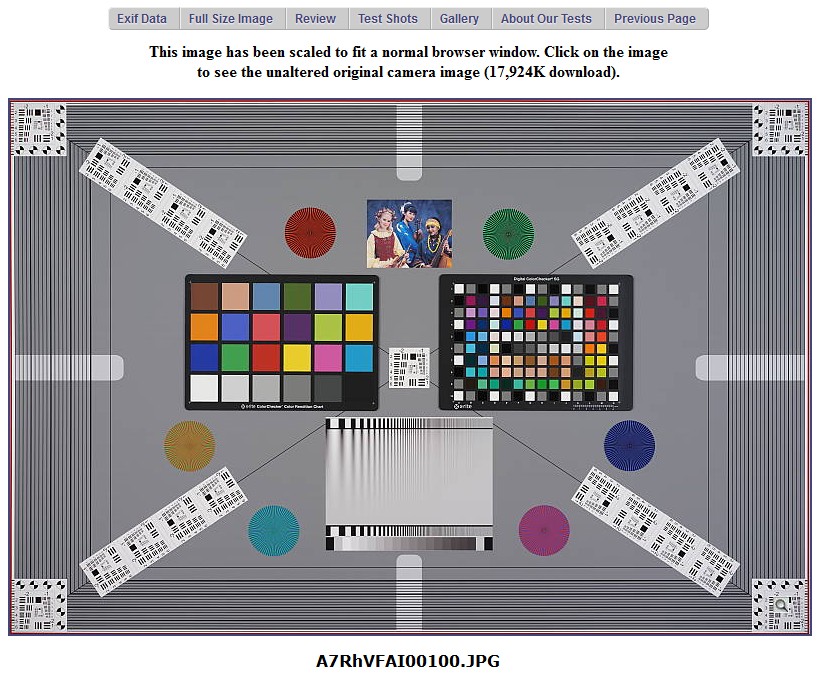
Imaging-Resource Multi Target image
The Log F-Contrast chart
The Log F-Contrast chart increases in spatial frequency from left to right and decreases in contrast from top to bottom. (Actually the square of the contrast is proportional to the distance from the bottom, so contrast in the middle is 1/4 of the contrast at the top. This makes the chart look much better.)
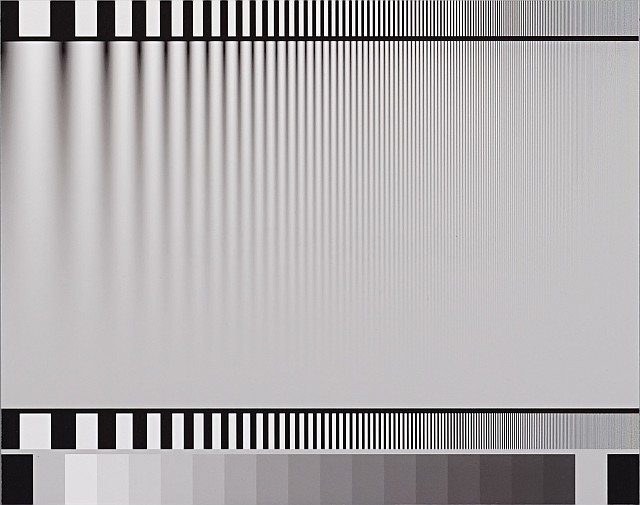
Log F-Contrast chart image
Details of running the Log F-Contrast are given in Log F-Contrast instructions. We focus on results here. The image below shows the normalized MTF* for several rows in the chart from near the top (row 1 of 25) to about 80% of the way to the bottom (row 19 of 25). (MTF curves for rows below this are unreliable due to noise and low contrast.)
*MTF (Modulation Transfer Function), which is generally equal to SFR (Spatial Frequency Response)
is a measure of image sharpness, described in Sharpness: What is it and how is it measured?
Sony Alpha A7R
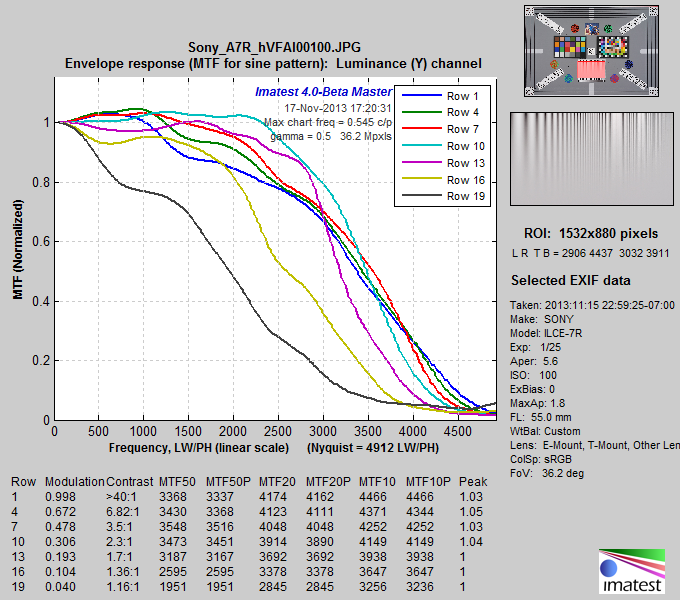 Sony A7R: Normalized MTF for bands from just below the top to near the bottom
MTF (i.e., sharpness) is fairly consistent for rows 1 through 10 (the relatively high contrast portion near the top of the image), with no significant sharpening peaks (Sony’s claim of no “halos” is well-justified). The long MTF ramp is an indication of nicely done sharpening. Sharpness starts to fall at row 13 (1.7:1 contrast), and drops significantly for rows 16 and 19.
This is the result of noise reduction, which is equivalent to lowpass filtering (smoothing), and which depends on image content in most consumer cameras. Noise reduction is minimum (and its inverse, sharpening, i.e., high frequency boost, is maximum) near contrasty features— near the top of the chart. Noise reduction is strongest in smooth areas— in the absence of contrasty features— near the bottom of the chart.
|
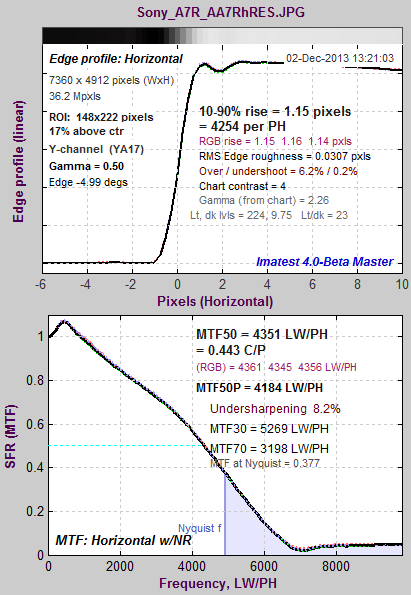
Comparison with slanted-edge measurements Results from Log F-Contrast illustrate how sharpening increases with feature contrast in the JPEG output files of most consumer cameras. Slanted-edges tend to maximize sharpening, especially if they are contrasty. Imaging-Resource has an A7R image of the ISO-12233 chart, which has several high-contrast edges, making for a convenient comparison. The average edge and MTF are shown on the right. Results are quite close to row 1 of the Log F-Contrast results (blue curve, above) up to about 3000 LW/PH, but the slanted edge has higher MTF at higher spatial frequencies. It has quite a lot of energy above Nyquist, which is characteristic of a system with no anti-aliasing filter + a very sharp lens. This can be an indicator of aliasing (color moire), but none is visible in the image. This is very impressive performance. |
 |
Since the multiple MTF image (above) is somewhat difficult to interpret, Imatest produces a contour plot of normalized contrast (MTF) over the image. This plot clearly shows how MTF varies with chart contrast.
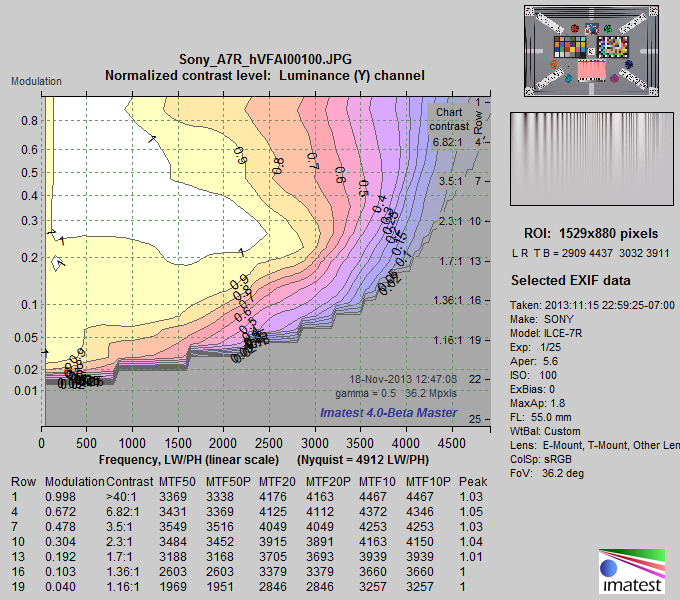
Sony A7R: Normalized contrast plot
This display is clearer than the MTF plot above: it contains results for all rows with sufficient contrast for MTF to be measured. It’s much easier to see how MTF drops as contrast decreases. It also displays key summary metrics: MTF50 (the spatial frequency where contrast falls to 50% of its low frequency value), MTF50P (the spatial frequency where contrast falls to 50% of its peak value), and comparable numbers for 20 and 10% contrast (which are more closely related to “vanishing resolution”). MTF50P is the most robust summary metric than MTF50: it is less sensitive than MTF50 to strong sharpening (not present here, but significant in the Canon EOS-6D).
Significant texture loss due to noise reduction is visible for modulation under 0.2 (chart contrast ratio under 1.7:1). This typical behavior for JPEG processing. If you want this detail you’ll have to convert raw images off the camera (with noise reduction turned down). The MTF50P values over 3,000 Line Widths/Picture Height are outstanding, particularly considering that there is no sharpening peak. With good technique you can expect razor-sharp 24×32 inch prints (the largest you can print in this format on a 24-inch printer)— and you can go a lot larger with excellent quality. How many photographers actually make larger prints?
Regarding Sony’s claim of an excellent sharpening algorithm with no (significant) halo, we know from slanted-edge analysis that MTF (spatial frequency response) peaks above 1 correspond to halos near edges, and that the strength of the halo is well correlated with the strength of the peak. Halos corresponding to MTF peaks under 1.1 (10% above the low frequency MTF) are generally too weak to be objectionable. So the verdict on the Sony A7R is yes, it lives up to its claims, but it’s hardly unique in that regard: the Pentax 645D, the Nikon D800 and some others (but notably not the Canon EOS-6D), also have excellent sharpening without a significant sharpening peak.
Pentax 645D
The 40-megapixel medium-format Pentax 645D is the camera to beat.
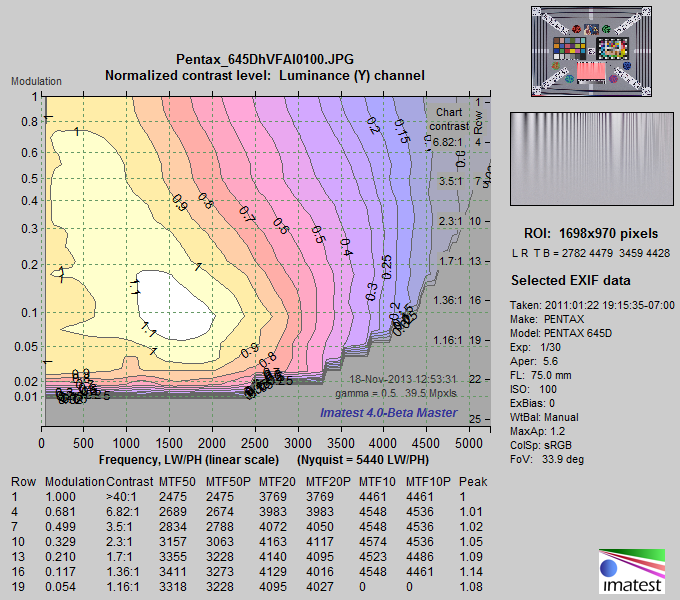 Pentax 645D: Normalized contrast plot
(Note that the horizontal scales are different for each plot: the maximum frequency is the Nyquist frequency.)
At high contrast levels the Sony does indeed beat the Pentax! But the Pentax appears to have NO noise reduction: MTF doesn’t drop until modulation gets down to 0.03— an extremely low level. The Pentax wins for reproducing extremely fine texture at modulation levels below 0.2. I would guess that a properly processed raw image from the Sony A7R would have comparable low-level detail (see the RX100 II raw image, below), though there might be more noise (which might not be objectionable at this ISO speed).
The Sony holds its own very well against the Pentax, which is particularly impressive considering its size, weight, and cost. The difference would only be noticeable in very large prints.
Nikon D800
Unfortunately I couldn’t find a Multi Target image for the D800E (the version without the anti-aliasing (optical lowpass) filter). This would have made for a much better comparison.
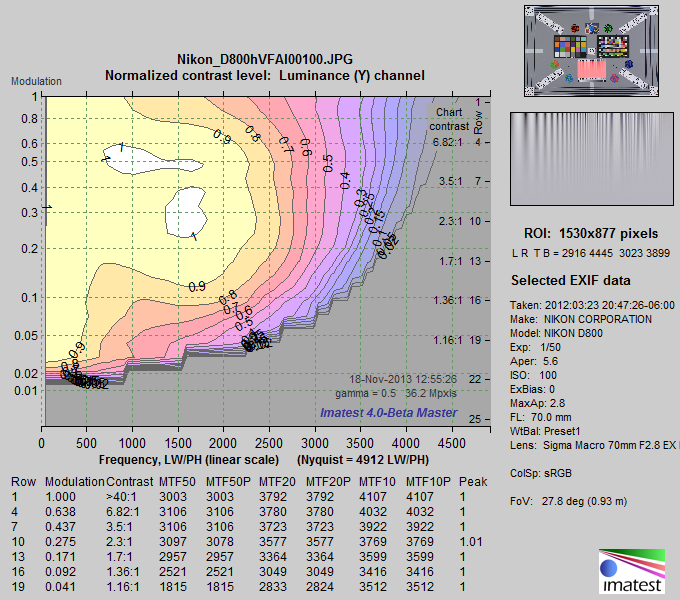
Nikon D800: Normalized contrast plot
(Note that the horizontal scales are different for most plots, but this is the same as the Sony A7R.)
Signal processing is quite similar to the Sony A7R, but MTF frequencies are about 15% lower, which is what you’d expect from the added anti-aliasing (optical lowpass) filter. We would expect performance comparable to the A7R with the D800E, which doesn’t have an anti-aliasing filter. Of course the lens could have some effect, though excellent lenses at or near optimum aperture have been used in both cases (and in other Imaging-Resource images). The lens is probably not the dominant factor here.
Canon EOS-6D
 Canon’s JPEG processing— and I mean sharpening, not JPEG compression— masks the 6D’s full performance potential. (It could probably be corrected in firmware if Canon wanted.) To begin with, the image is strongly oversharpened. Halos will be clearly visible in moderately large prints (as they are in IR’s image). And the sharpening radius is 2, which boosts middle but not the highest spatial frequencies (explained here). A sharpening radius of 2 is good for moderate enlargements with average quality lenses, but it’s hardly optimum when maximum quality is required. I never use JPEGs for high quality prints from the 6D; I always convert from raw and sharpen with a smaller radius with excellent results— I’ve made some outstanding 16×24 inch prints from the 6D.
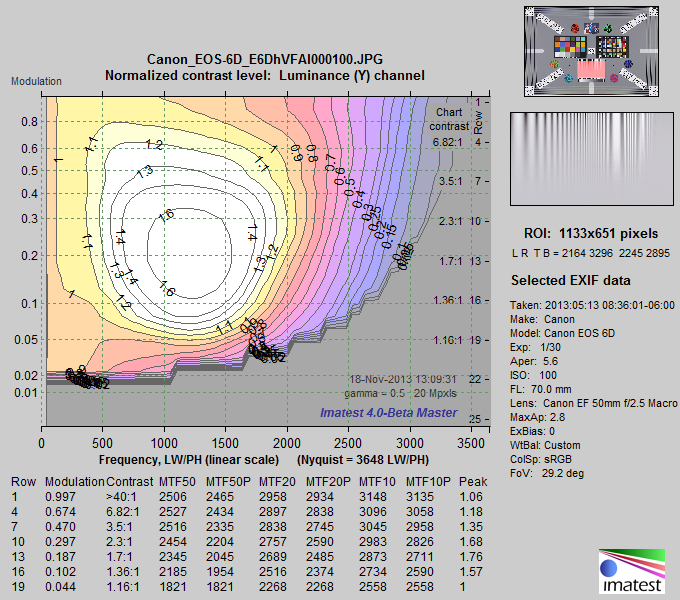
Canon EOS-6D: Normalized contrast plot
(Note that the horizontal scales are different for each plot: the maximum frequency is the Nyquist frequency.)
Despite the sharpening, MTF50P is well below that of the Sony A3R. This is because of the way Canon’s sharpening (with radius = 2) works, boosting middle but not high spatial frequencies, and partly because the Sony has more pixels combined with an excellent lens and no anti-aliasing filter. With raw images the difference would be reduced, but the Sony is the clear winner here.
Panasonic Lumix DMC-G3
The G3 is a 16-megapixel Micro Four-Thirds mirrorless interchangeable system camera that I’ve had since 2011 (two years ago as I write this). It’s much smaller and lighter than than APS-C or full-frame DSLRs; it’s easier to carry on long trips.
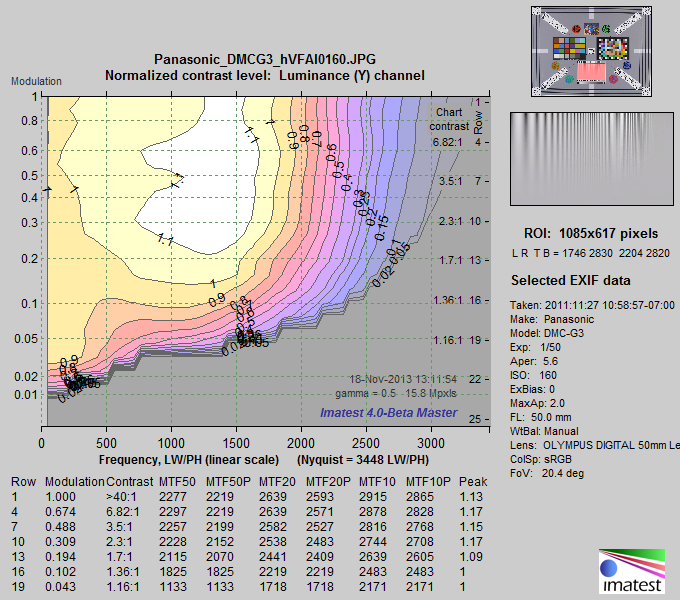
Panasonic Lumix DMC-G3: Normalized contrast plot
(Note that the horizontal scales are different for each plot: the maximum frequency is the Nyquist frequency.)
MTF50P in the range of 2200 is respectable for a camera in this category, though not in the same class as the Sony, Pentax, and Nikon cameras above. There is a moderate sharpening peak— not enough to be objectionable in any viewing conditions. Noise reduction is strong for modulation under 0.2— pretty similar for most of the cameras in this post, except for the Pentax. I’ve made some very nice 18×24 inch prints with this camera, using an off-camera raw converter (though they’re not quite as good as processed raw images from the EOS-6D— not JPEGs).
Panasonic Lumix DMC-LX7
Nobody, and I mean nobody, will take you for a serious photographer if you carry one of these little toy-like cameras. But appearances can be deceiving. A toy it is not. This 10-megapixel point and shoot (with an f/1.4 Leica zoom lens) is capable of some pretty impressive image quality for a slightly larger than pocketable point-and-shoot. I carry this camera when I’m feeling lazy but want to make fine images should the opportunity arise.
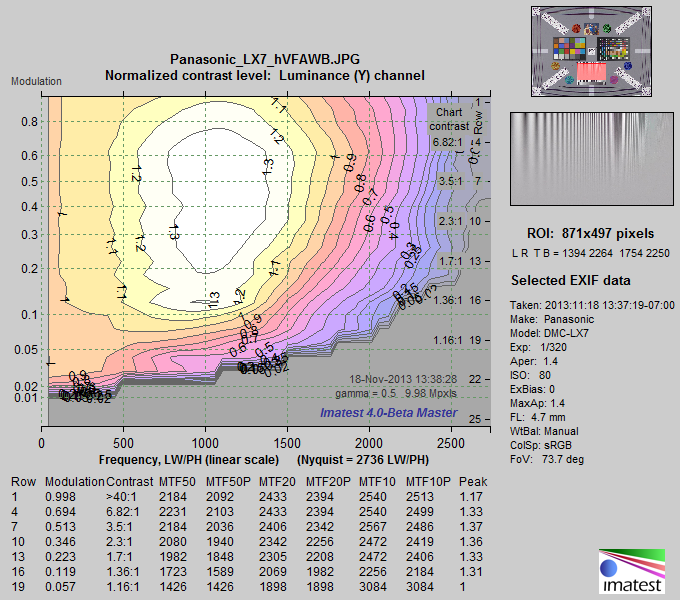
Panasonic Lumix DMC-LX7: Normalized contrast plot
(Note that the horizontal scales are different for each plot: the maximum frequency is the Nyquist frequency.)
Sharpening is rather strong, with the sharpening peak reaching 1.37, which might be objectionable in large prints. (Raw is available.) It might be a good idea to decrease sharpening from the default level. MTF50P above 2000 at high contrast levels is excellent for a 10 megapixel camera, thanks to an excellent lens and strong sharpening with radius R = 1 (which does a much better job than the R = 2 sharpening in the EOS-6D, as explained in the Sharpening page).
Sony RX100 II
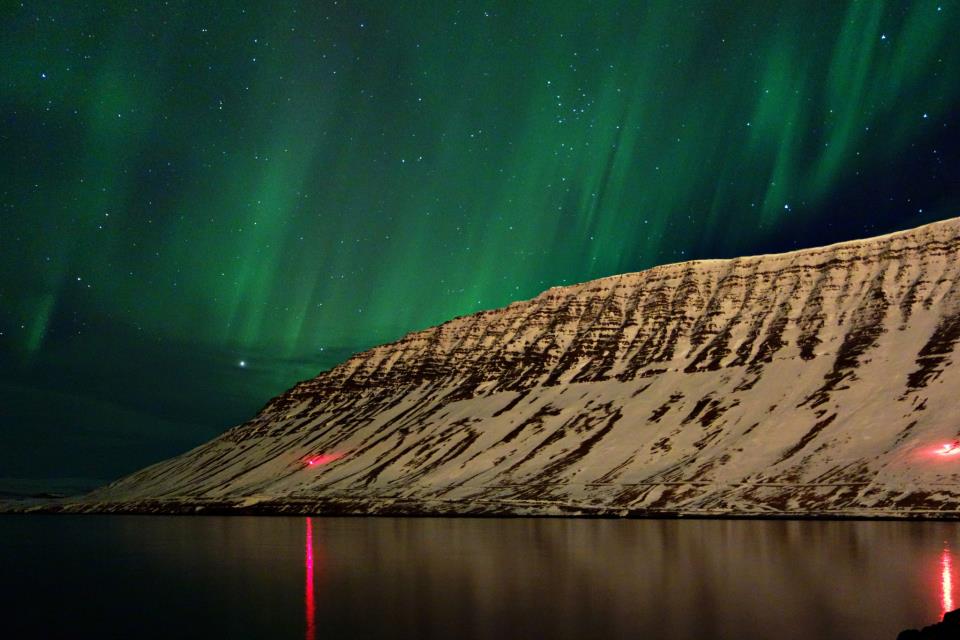
My London son is absolutely delighted with his 20-megapixel RX100 (with a Zeiss f/1.8 zoom lens), which he first used to take pictures of the aurora borealis in Iceland (an application that requires excellent low light performance). It’s small enough to fit in most pockets (slightly smaller than the LX7). We’ll look at the RX100 II, which is the current model. It has a large (1-inch) sensor, unusual for such a small camera.
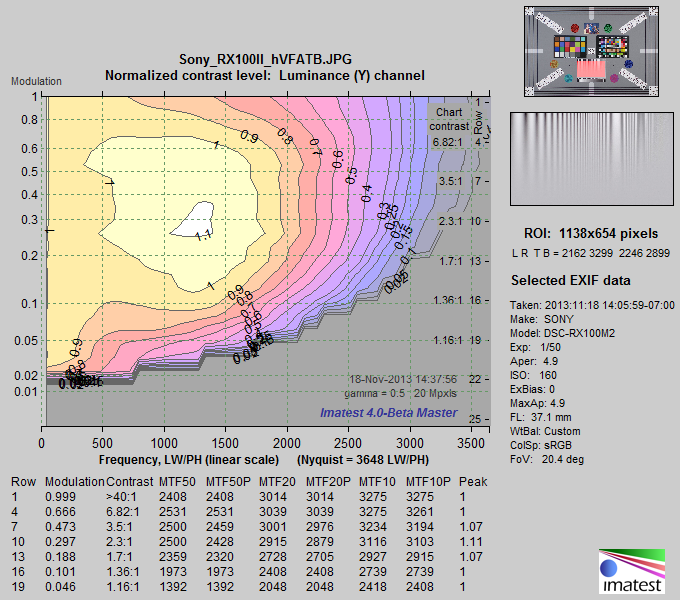
Sony RX100 II: Normalized contrast plot: JPEG image
(Note that the horizontal scales are different for each plot: the maximum frequency is the Nyquist frequency.)
Note that MTF50P for modulation above 0.1 is better than the Canon EOS-6D, despite the Canon’s strong sharpening. Impressive for a camera you can put in a pocket! Only at very low contrast does the big Canon out-perform the little Sony. The Sony is also quite a bit better (higher MTF50P with less sharpening) than the slightly-larger but less expensive Panasonic LX7.
The reduced MTF at very high modulation levels (above 0.8) is caused by signal processing— I’m not sure why. Imaging-Resource has supplied a raw (ARW) version of this image, which we converted using dcraw, which has no sharpening or noise reduction. Here is the plot, which shows a MTF falloff characteristic of an unsharpened image and vertical contour lines characteristic of no noise reduction
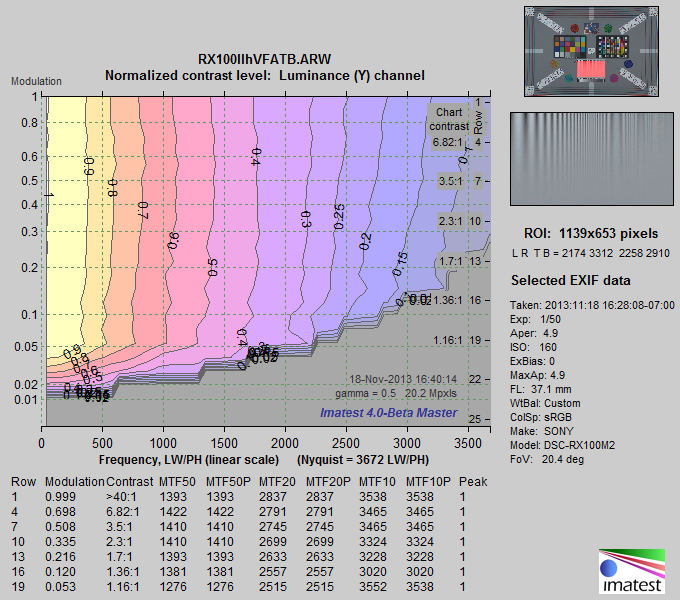
Sony RX100 II: Normalized contrast plot: raw (ARW) image converted by dcraw
The Sony RX100 II hits a real sweet spot: it’s small enough to fit in most pockets and capable of making serious enlargements. It may well meet the holy grail requirements. If nothing else, the new crop of cameras removes technical excuses for not making great images. (It’s still not easy to make iconic images, mostly because billions of images are made daily, and it’s hard not to get lost in the crowd. But that issue is outside the scope this post.)
Fuji X-E2 / X-M1
The recently-released (November 2013) Fuji X-E2 is a mirrorless camera with interchangeable lenses (very well reviewed) that features an eye-level electronic viewfinder. Since images are not available, we display results for the X-M1, which has an identical 16 megapixel X-Trans sensor that features a new color filter array (CFA) pattern that reduces aliasing, allowing the anti-aliasing (Optical Lowpass) filter to be eliminated for improved resolution.
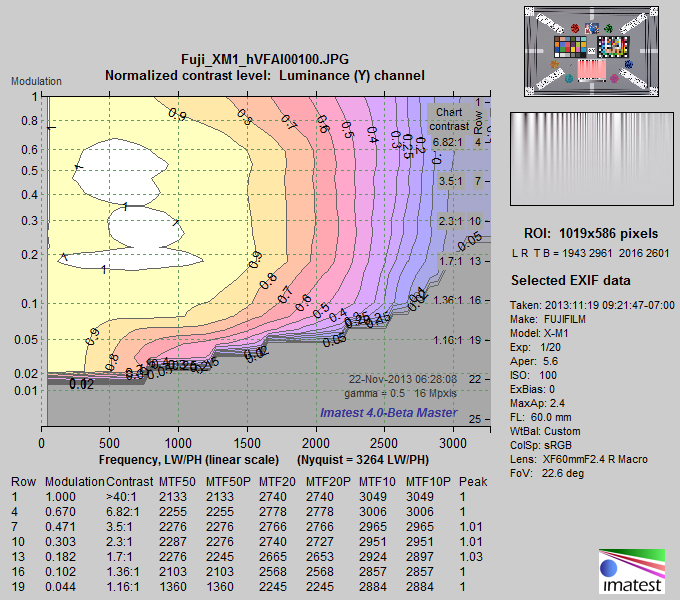
Fuji X-M1: Normalized contrast plot
MTF is significant all the way out to the Nyquist frequency (right of the graph), which is consistent with the absence of an anti-aliasing filter. Sharpening is very conservative, with a maximum peak of 1.01. MTF values would improve with additional (small radius) sharpening. Noise reduction is also conservative, not starting until modulation drops under 0.1, which is lower than most of the cameras in this post. The New York Times just published an article about Fujifilm and the X-series, which has sold very well in a tough market.
Sigma DP1 Merrill
I won’t be purchasing this compact 14.8 megapixel camera because it has a fixed lens, and I want a zoom— available on several competitive cameras. I’m including it because I’m intrigued by the Foveon sensor, which has no color filter array and no anti-aliasing (Optical Lowpass) filter, and can potentially outperform Bayer sensors with comparable pixel count.
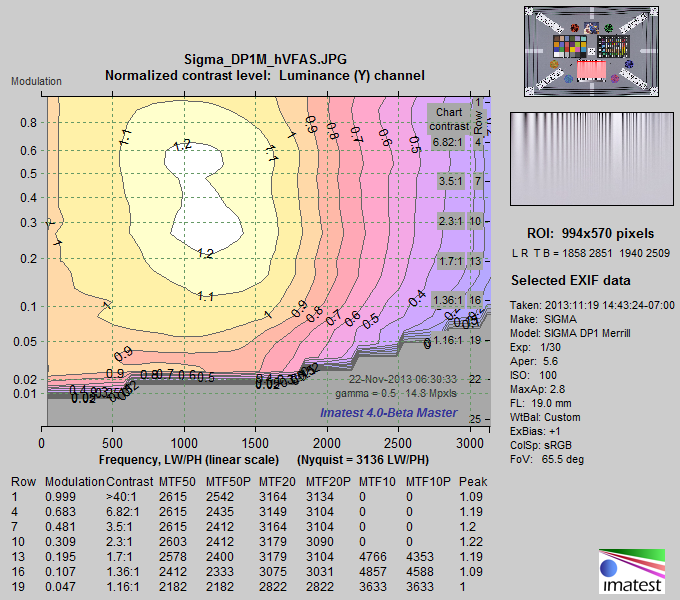
Sigma DP1 Merrill: Normalized contrast plot
Moderate sharpening (maximum peak = 1.22) is not likely to be objectionable. MTF is outstanding for a 14.8 megapixel sensor, and it remains significant right out to the Nyquist frequency— a clear benefit to not having an anti-aliasing filter (and having a fine lens). The low amount of noise reduction is also notable: It doesn’t really start until modulation drops below 0.05 (1.16:1 contrast). This would contribute to Sigma’s reputation (attributed mostly to the Foveon sensor) of maintaining exquisite fine detail. Now, if only it had a zoom lens like the RX100…
Summary
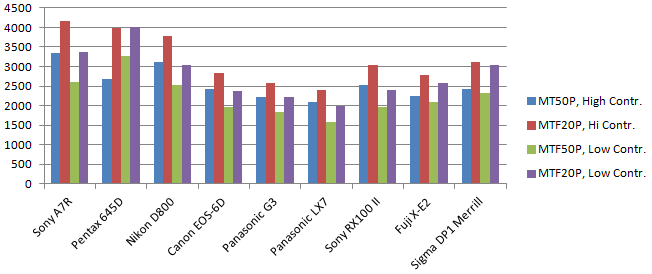
To distill the above results, we have created a table of summary metrics.
- MTF50P, LW/PH, row 4. The best overall sharpness metric for contrasty areas (where modulation ≈ 0.7). MTFnnP is less sensitive to oversharpening than MTFnn.
- MTF20P, LW/PH, row 4. A metric that approximates vanishing resolution in contrasty areas.
- MTF50P, LW/PH, row 16. The best sharpness metric for low-contrast areas (modulation ≈ 0.12).
- MTF20P, LW/PH, row 16. A metric that approximates vanishing resolution in low-contrast areas.
- Peak (maximum) A measure of the maximum sharpening MTF overshoot. Sharpening is excessive if too high.
| Measurement→ Camera↓ |
MTF50P, row 4, High Contrast |
MTF20P, row 4, High Contrast |
MTF50P, row 16, Low Contrast |
MTF20P, row 16, Low Contrast |
Peak (max) |
Comments |
| Sony A7R 36 Mpxl |
3338 | 4163 | 2603 | 3379 | 1.05 | No sharpening peak, as claimed. Outstanding MTF. |
| Pentax 645D 40 Mpxl |
2689 | 3983 | 3273 | 4016 | 1.14 | MTF highest at 0.1 modulation (strange). Best fine detail; no noise reduction. |
| Nikon D800 36 Mpxl |
3106 | 3780 | 2521 | 3049 | 1.01 | D800E would have been nicer. |
| Canon EOS-6D 20 Mpxl |
2434 | 2838 | 1954 | 2374 | 1.68 | Extreme sharpening, radius = 2. Use raw for best results. |
| Panasonic G3 16 Mpxl |
2219 | 2571 | 1825 | 2219 | 1.17 | |
| Panasonic LX7 10 Mpxl |
2103 | 2394 | 1589 | 1982 | 1.37 | Strongly sharpened, radius = 1; near acceptable limits. Good performance. Least expensive of the batch. |
| Sony RX100 II 20 Mpxl |
2531 | 3039 | 1973 | 2408 | 1.11 | Outstanding performance for such a tiny package. |
| Fuji X-E2 16 Mpxl |
2255 | 2778 | 2103 | 2568 | 1.03 | Low noise reduction; extended MTF. |
| Sigma DP1 Merrill 14.8 Mpxl |
2435 | 3104 | 2333 | 3031 | 1.22 | Exceptionally low noise reduction: will render very fine detail. |
 Final comments and observations
All of the cameras discussed in this page make excellent images.
- The 36-40 megapixel cameras (Sony, Pentax, Nikon) are capable of outstanding performance, but you won’t see it unless you
- Use the finest lenses: Ordinary consumer-grade lenses can rarely take advantage of these very high resolution sensors.
- Print large: At 13×19 inches (common for home printers) you won’t see a difference.
- Use good technique: keep the camera steady during exposure and set the lens close to optimum aperture.
If you can’t meet all of these criteria, you can save a lot of money (and weight and storage) by sticking with a camera with 20 or fewer megapixels. 10-20 megapixel cameras with good optics are capable of making phenomenally fine 13×19 inch (or larger) prints, and they’re smaller, lighter, and less expensive. So why bother unless you want to look like a serious photographer (and maybe strain your neck in the process)?
- I’ve always been suspicious that mirrors compromise sharpness, especially for long lenses, though I haven’t done a controlled study. The lack of a mirror was one of the key advantages of the old Leicas (I still have my M2R), and it’s still an advantage, even though mirrors have improved (my EOS-6D is much smoother than my film SLRs). This makes the Sony A7R very attractive compared to the Nikon D800(E) and Pentax D645 (which is considerably more expensive and heavier). But I won’t run out to buy an A7R because few lenses are available (as of November 2013). They’ll be coming out over the next year, and I expect them to be excellent: I’ll be watching the reviews.
- Smaller mirrorless cameras (APS-C and Micro Four-Thirds from Panasonic, Sony, Olympus, Fuji, and others) are very appealing alternatives if you don’t need to make giant prints.
- Although the Panasonic LX7 is very good, the more expensive Sony RX100 II hits a real sweet spot when you balance its size, weight, and image quality. It’s a bargain for what it does. My son convinced two of his friends to buy them.
- Most of these cameras have fairly strong noise reduction that results in loss of fine texture. (The Pentax, Fuji, and Sigma are the exceptions.) Whether or not this is a good thing is a matter of taste. You can recover the texture by turning down the noise reduction (if an adjustment is available) or by performing raw conversion off the camera using little or no noise reduction.
Sony has planted a bit of lust in my brain. I’ll be watching the growth of the A7R system. One day I may make a very rash, very large purchase (with a lot of thought and analysis behind it).