Recent growth in the automotive and security industries has increased the number of cameras designed for viewing both Near Infrared (NIR) and visible wavelengths of light. NIR illumination is invisible to the human eye and can light a dark scene without being visible or annoying. Because silicon sensors are sensitive out to 1100 nm — well beyond NIR wavelengths of interest — existing consumer systems require only a small modification, the removal of the infrared filter, to allow them to image NIR. This makes dual-band security cameras cost-effective and attractive to the industry.

The Response of Silicon Photodiode
Care is required when dual-band cameras are tested for image quality. In this post, we will outline some best practices, including a selection of light sources and charts for measuring sharpness of cameras in the visible and NIR bands.
Note: We chose to measure sharpness because a dramatic change between bands could greatly reduce the system’s effectiveness. A critical function in many automotive and security systems is object identification or detection. A security camera that cannot identify an intruder because the image is not sharp enough is not doing its job, therefore it is one of the most important factors to test.
Camera
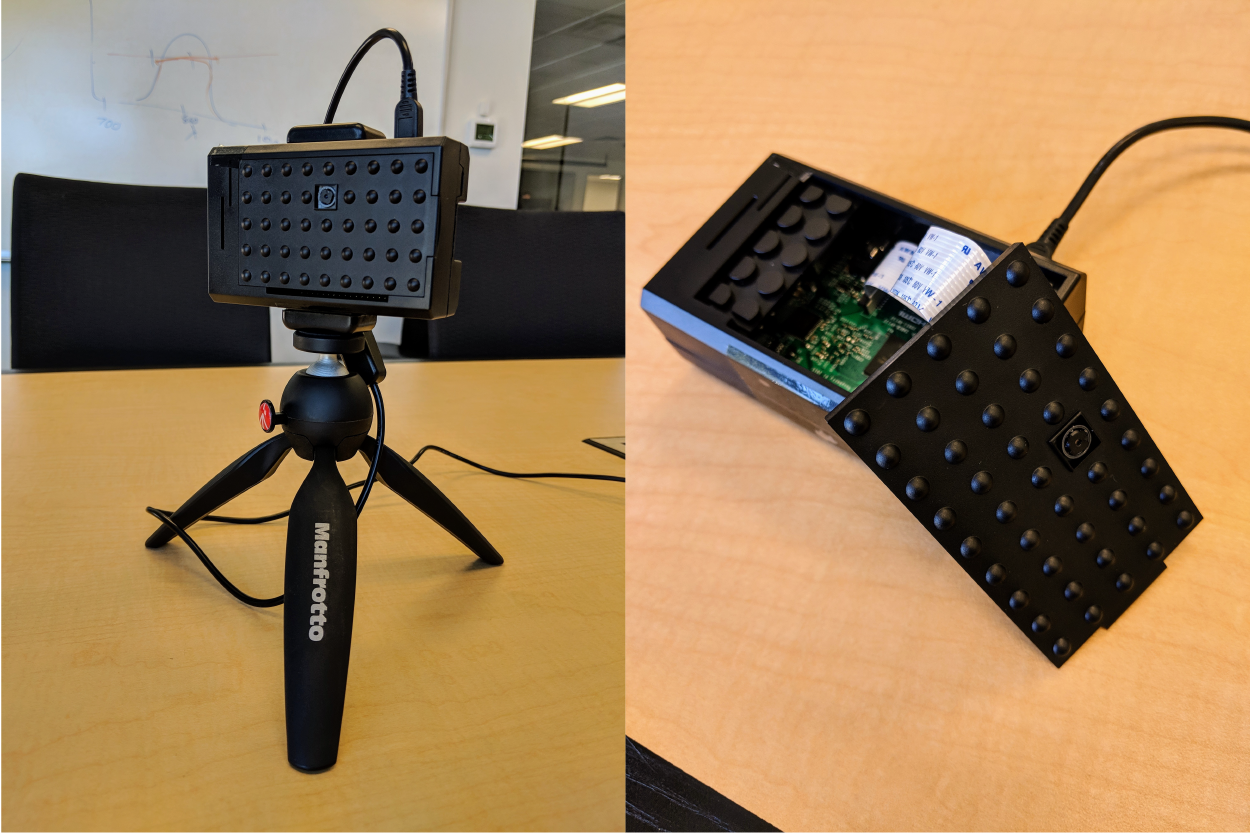
The camera we will test is the Raspberry Pi Camera V2 NoIR version. It is ideal because its IR filter has been removed, and functions identically to the normal Raspberry Pi camera module, which leads us to believe that it has identical image processing.
Lighting
As with any other test, the choice of lighting is crucial. In our setup, we will be testing under two specific lighting conditions: 5100K visible LED light and 850nm NIR LED light.
The first test is with the 5100K LED source.
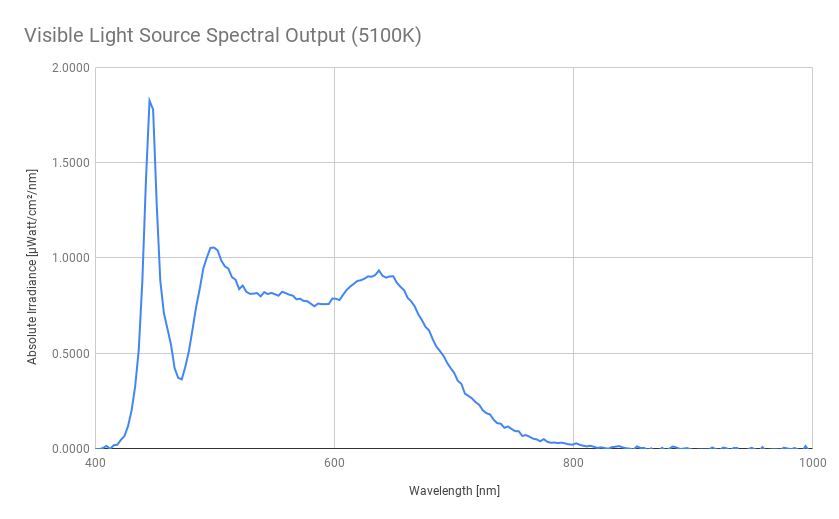
The plot above shows the spectral output of the 5100K source. There is a strong peak near 450 nm, but the spectrum is fairly constant across the visual range (400 – 700 nm). For more information about this light source, see our ITI LED lightbox.
The second source is a lightbox engineered with NIR LEDs with the spectral output centered around 850 nm. The plot below shows this distribution.
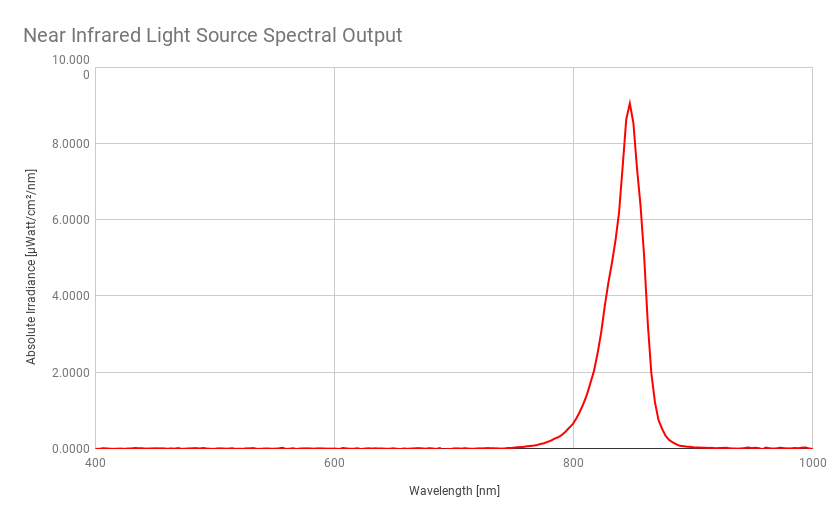
Contact [email protected] to learn more about our NIR lighting options.
It is important to avoid overlapping spectral response because it could confuse results from the two sources. We need to define how the system performs in each band. If the light sources overlap, we won’t be able to point to which band caused any change in quality.
Chart & Material
We use an eSFR ISO 12233 on a black and white LVT film to measure sharpness. There are a number of ways to measure sharpness and Modulation Transfer Function (MTF) such as wedges and Siemens stars, but for our purpose, we will use the slanted edges on the eSFR chart. For a better understanding of the advantages and drawbacks of each feature when measuring MTF, see this blog post.
The chart and material on which it is printed or developed are two of the most overlooked aspects in testing at NIR wavelengths. Not all reflective and transmissive charts perform the same in NIR as they do for visible light. For example, there are two types of film charts: color, and black and white. Both types work well in the visible wavelengths with only subtle differences. However, the color film is nearly transparent at longer wavelengths. This is demonstrated below.
We use slanted-edges in the eSFR ISO (ISO 122334:2014) chart, printed on Black and White (B&W) LVT film as our preferred method for measuring sharpness in NIR. The choice of chart media is critical since NIR response for some media may be very different from the visible response. The B&W film has excellent NIR response (extending to shortwave IR). Color LVT film charts cannot be used because they are transparent in NIR wavelengths. This is demonstrated below.
We can further understand the properties of these charts by looking at the spectral transmittance for each material (illustrated below).
![]()
The above plot shows that the color film’s transmission increases dramatically at NIR wavelengths. In contrast, the B&W film maintains a similar transmission throughout visible and NIR, making it ideal for this test.
The table below compares the NIR suitability of several chart materials.
|
Chart Material |
Lighting Type |
NIR Suitable |
|
Black and White LVT film |
Transmissive |
Yes |
|
Color LVT film |
Transmissive |
No |
|
Chrome on Glass |
Transmissive |
Yes |
|
Mylar photomasks |
Transmissive |
Yes |
|
Inkjet |
Transmissive |
Sometimes* |
|
Inkjet |
Reflective |
Sometimes* |
|
Photographic print |
Reflective |
Yes |
*For inkjet, a special print process is required. All inkjet charts are suitable for visible testing but not all are suitable for NIR. More info available at request by emailing [email protected].
Testing
We compare the sharpness of the same camera with visible and NIR illumination using a black and white film eSFR ISO chart. Images are analyzed using Imatest Master 5.1, with MTF50 (the spatial frequency where MTF drops to half its low-frequency value) as the image sharpness metric. Note that this is one of several summary metrics that could have been chosen. For more information, please visit our page, Sharpness, what is it and how is it measured?
We capture images of the same chart with the two different light sources (see below).
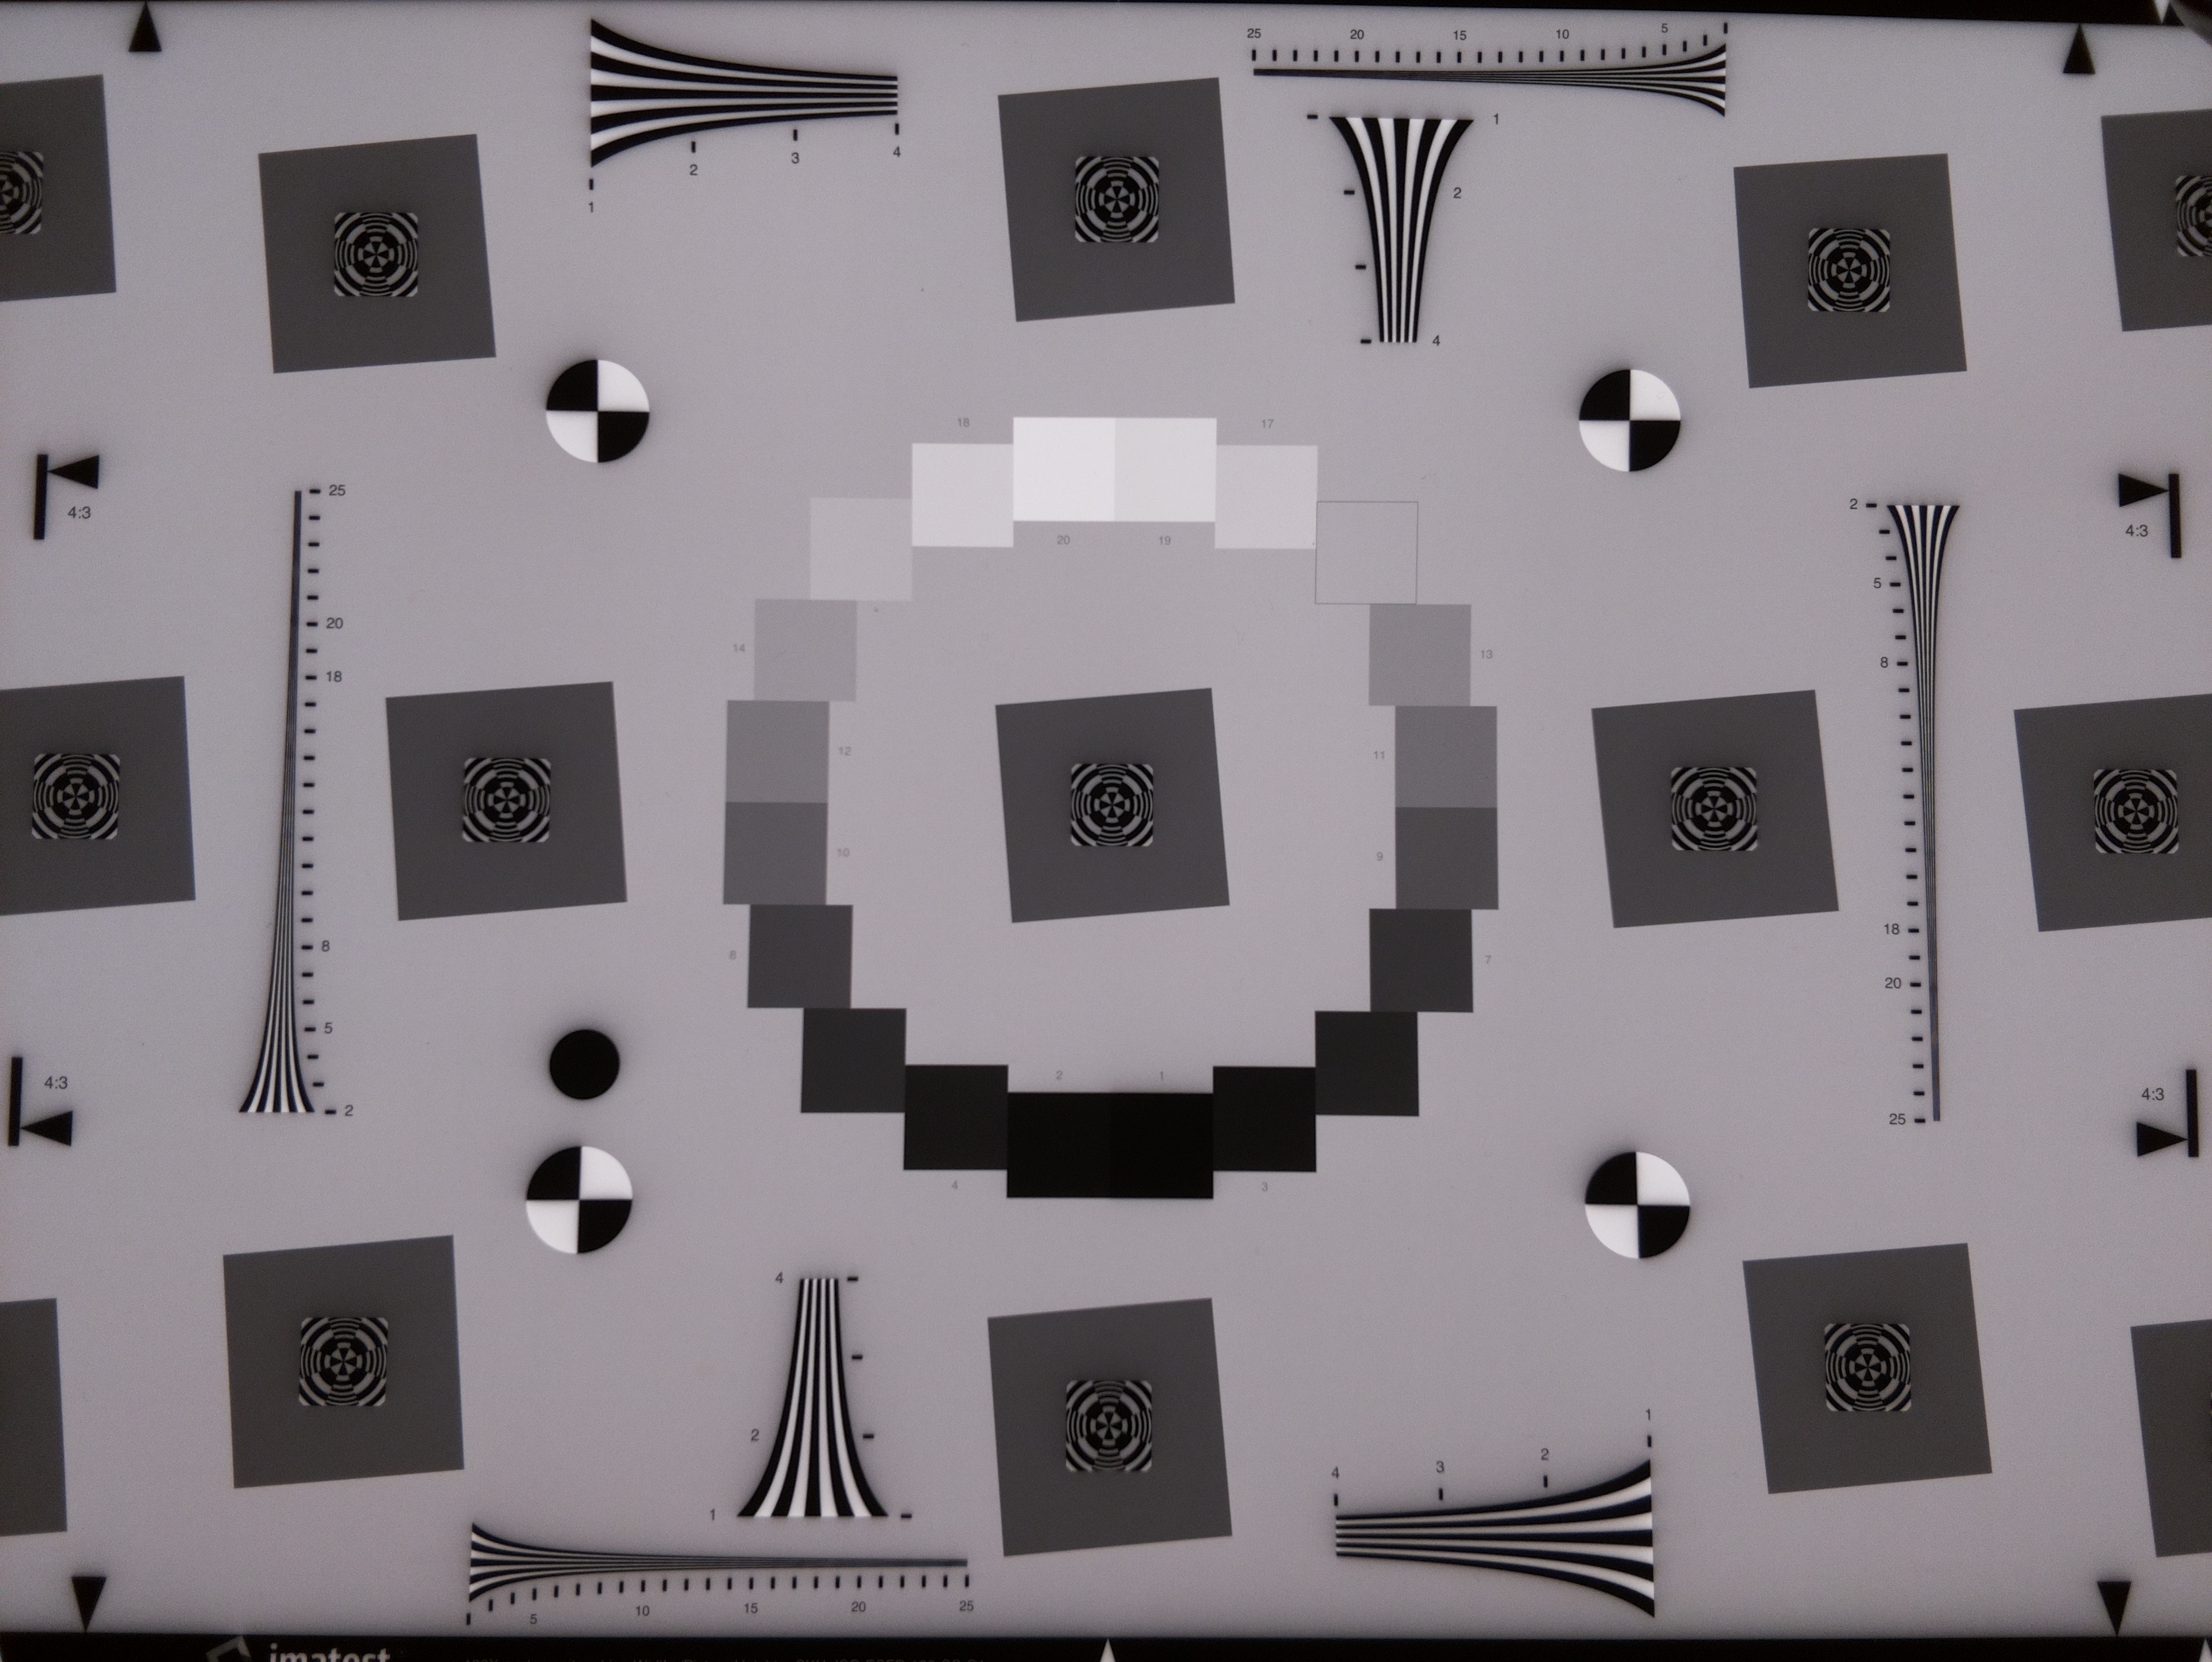
eSFR film with 5100K (visible) light source
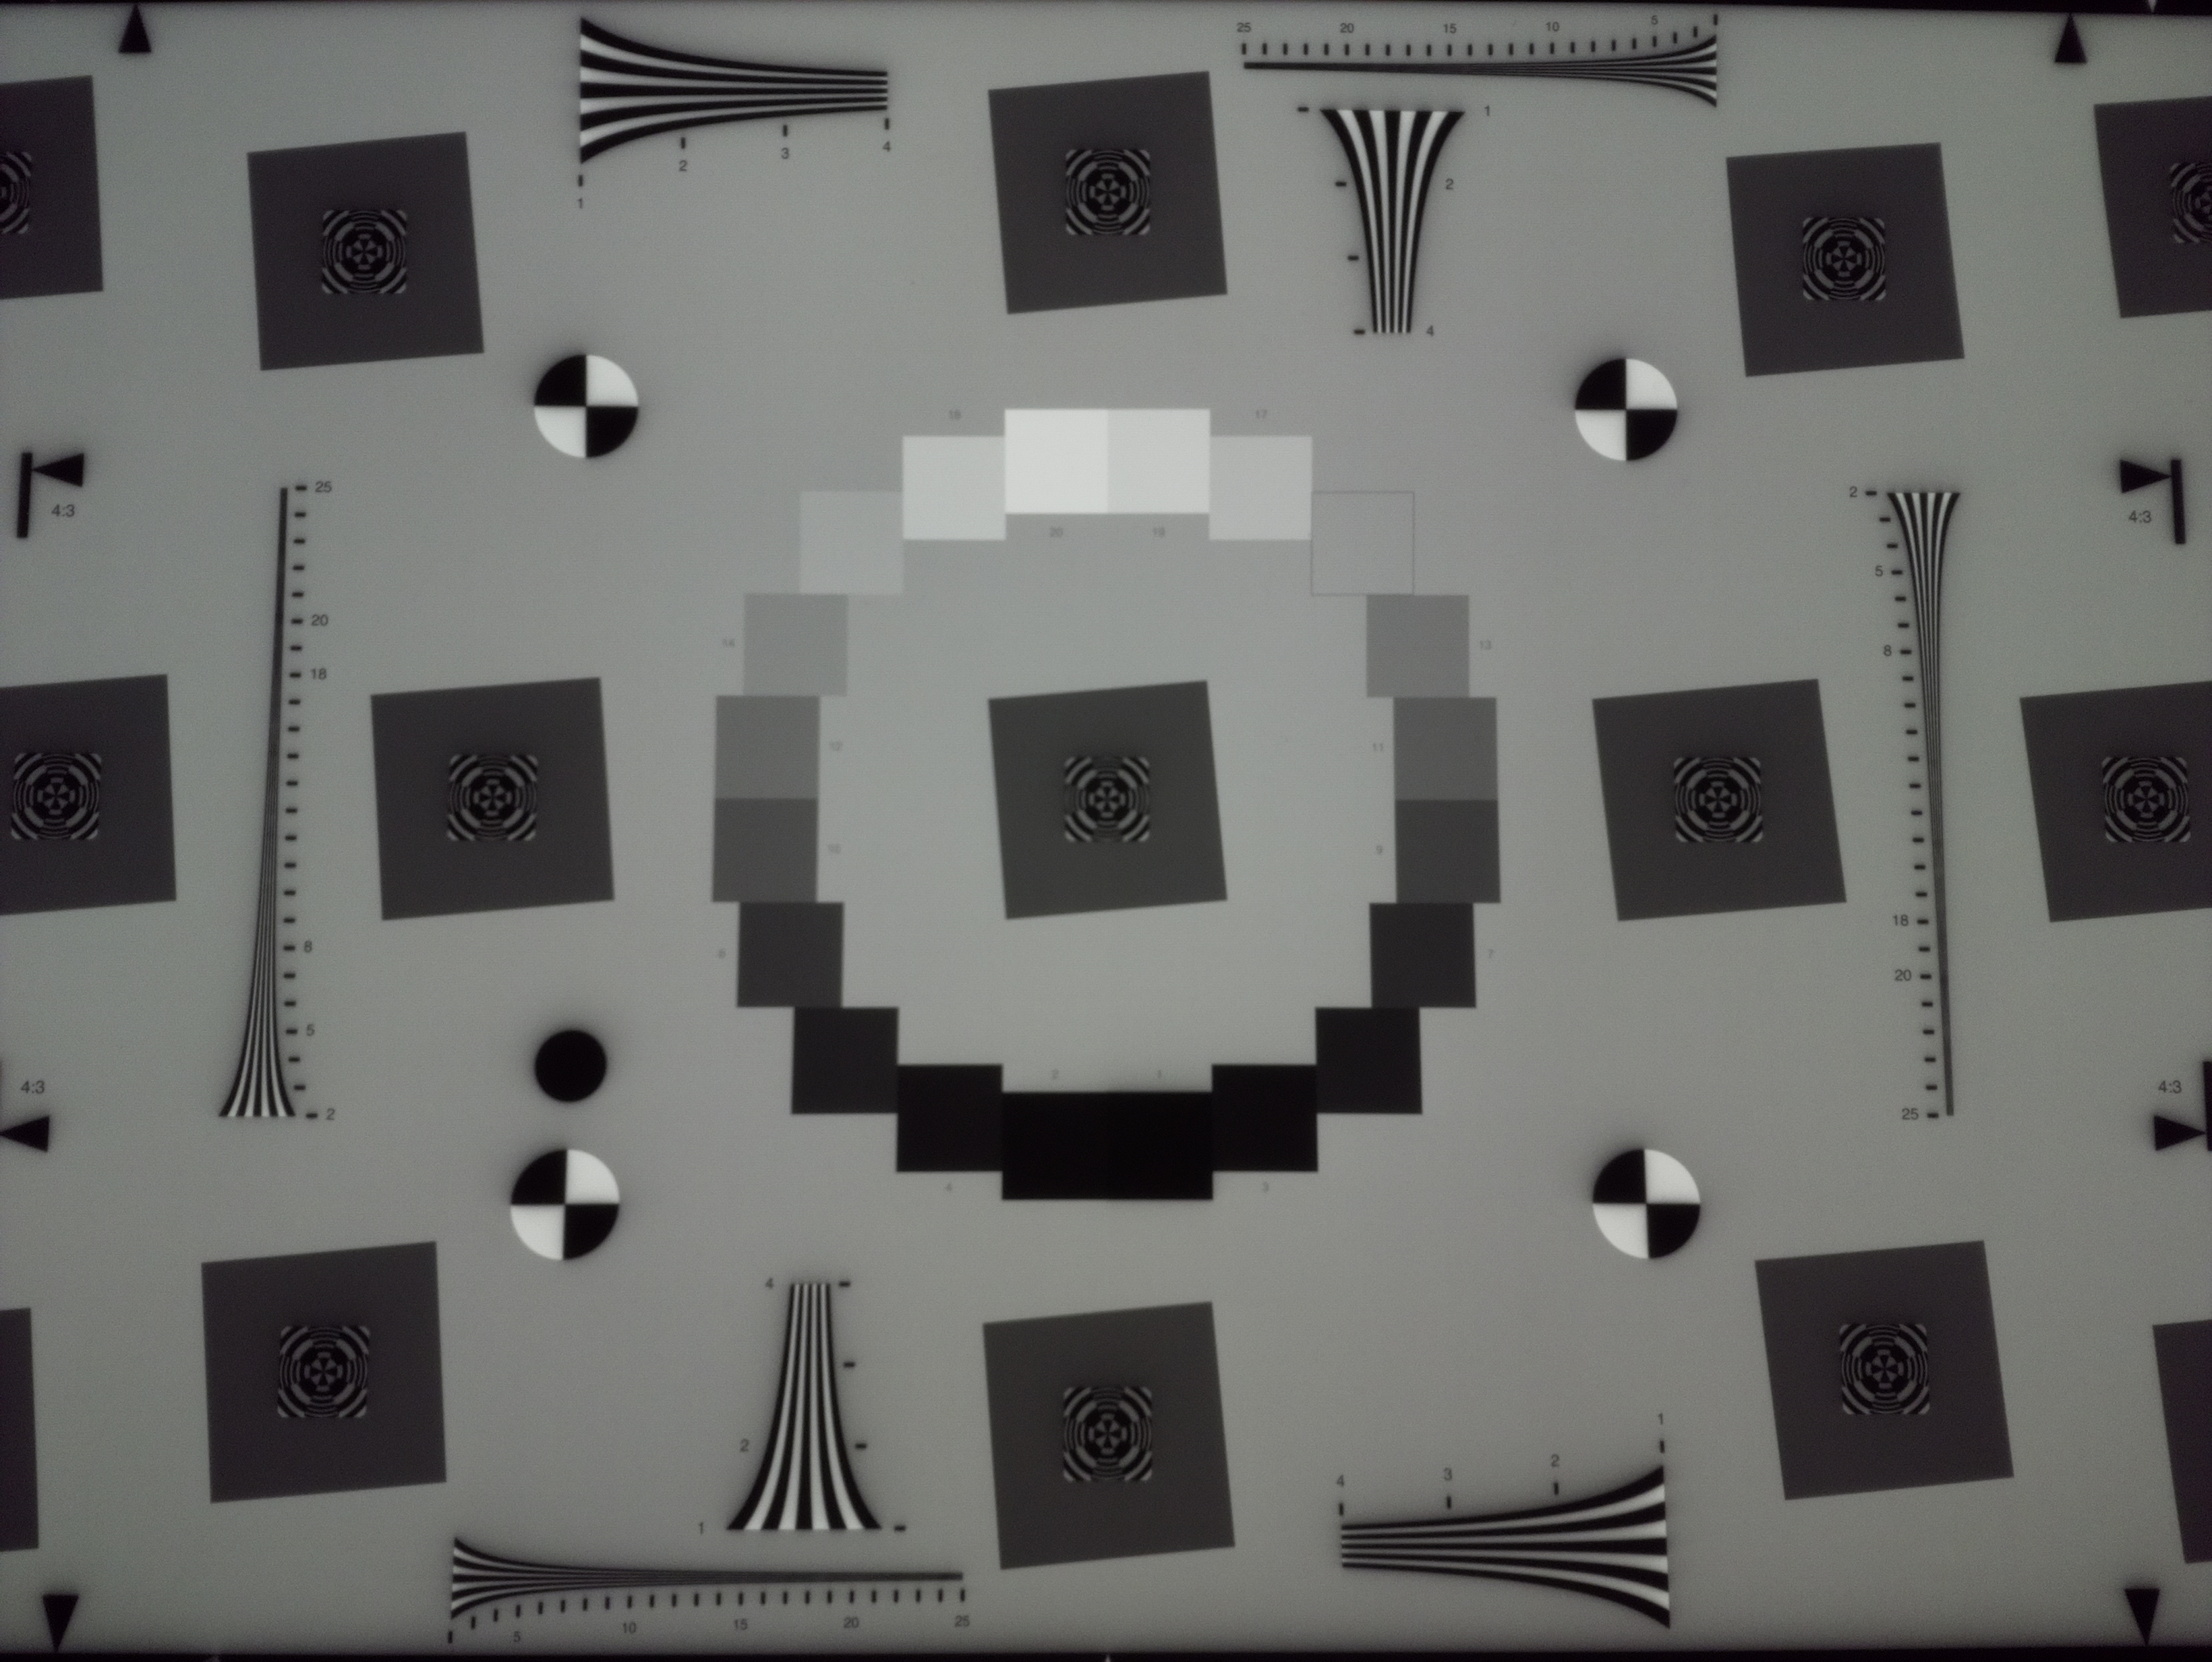
eSFR film with the 850nm (NIR) light source
Even before running an analysis of these images, we inspect for qualitative differences. The immediate observation is that the visible image is much sharper.
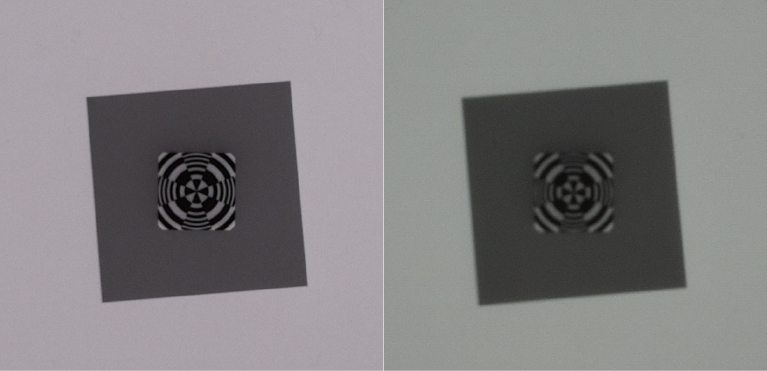 (left) visible, (right) NIR
The above images show crops of the center square of both images. The visible image on the left has much sharper edges and a clearer focus aid feature in the center. The difference is important to quantify, so we run these images through the Rescharts module in Imatest Master for proper analysis.
Results
Below are the Multi-ROI summary results output by Imatest.
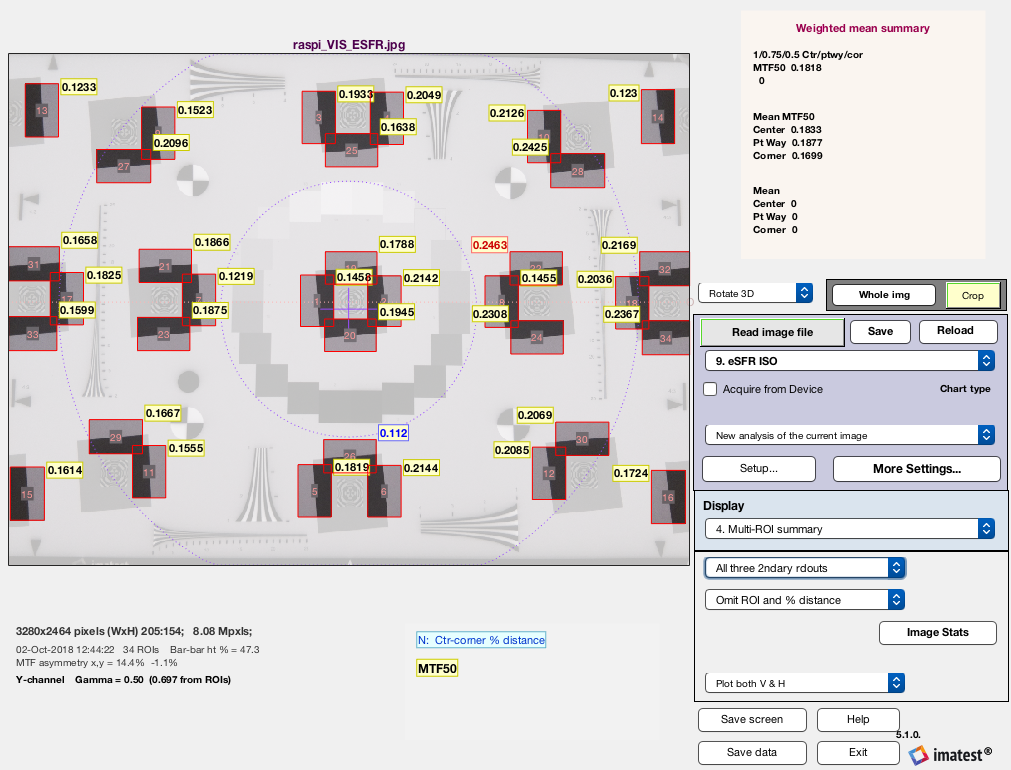
Multi-ROI Summary for 5100K image
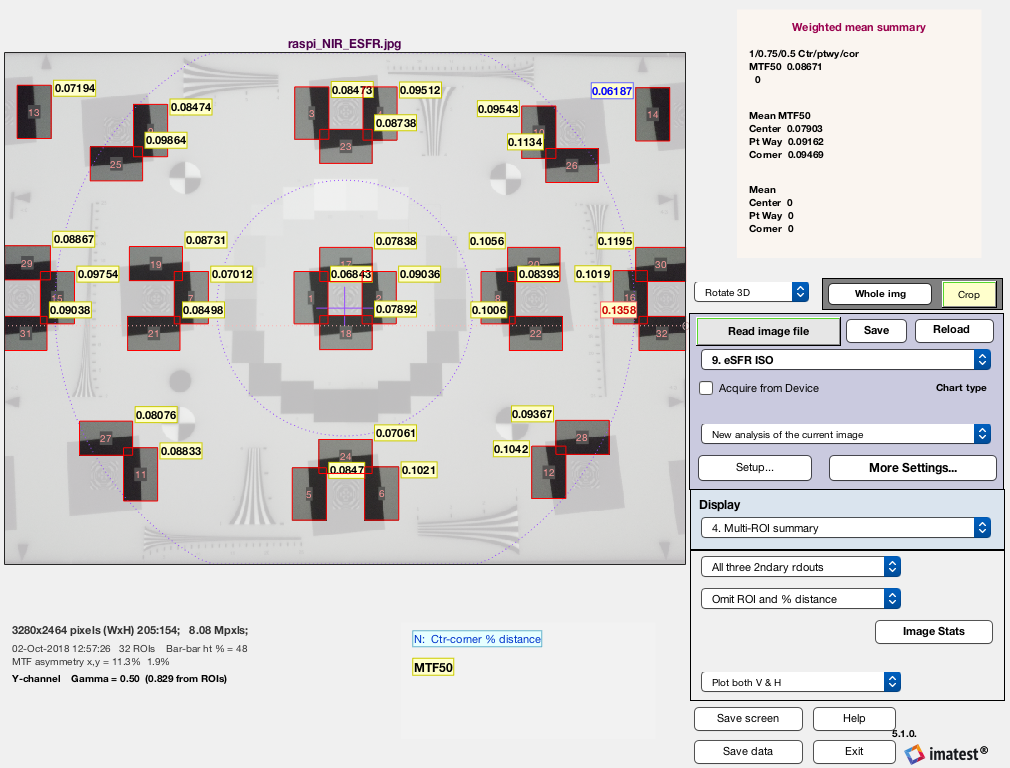
Multi-ROI Summary for 850 nm image
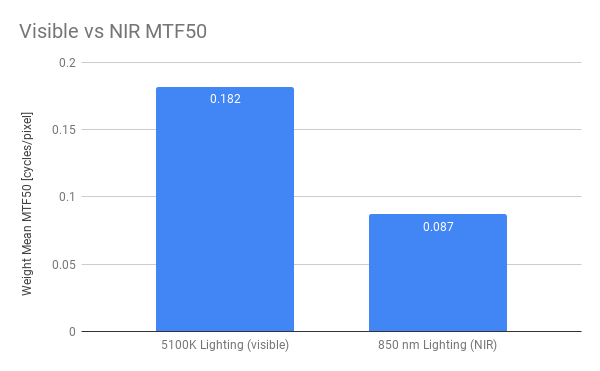
We choose a large number of ROIs to increase the data points for each image in order to get more representative results. These plots can show a variety of metrics for each edge (MTF20, Chromatic Aberration, etc.), but we are showing the primary result which is the weighted mean of MTF50 (summarized in the graph below). For more information about understanding and interpreting these plots, read our documentation on it.
Conclusions
The plot shows that there is a 52% change in mean MTF50 between the two light sources. This difference is quite significant and correlates well with our visual observations. There are several explanations: NIR focuses at a different location from visible light and has intrinsically lower sharpness due to its longer wavelength. There is more diffusion inside the silicon sensor. The difference may be reduced by a better choice of optics, better focusing, and improved sensors, but in general, we should expect the sharpness of NIR images do not equal that of visible light.
Wrap Up
Before you test your cameras for NIR, there are a couple things you need to consider:
- The quality of the image can vary per band (visible & NIR)
- Not all chart and material types are visible in NIR. However, certain charts and materials when printed or developed for NIR can work for both visible and NIR testing
If you have additional questions about testing NIR, contact us at [email protected].
Our engineers can help you set up your lab to test NIR. Submit a solution request and we will fit you with the right equipment.