View slides of this presentation here
Watch this on YouTube
Norman Koren describes a camera performance simulator that includes an image sensor noise model with parameters derived from either dynamic range test chart measurements or EMVA 1288 results. The simulator includes lens degradations and the effects of Image Signal Processing (ISP). Results can be analyzed for standard image quality metrics such as sharpness and noise, or new metrics, derived from information theory, that provide an improved prediction of machine vision system performance.
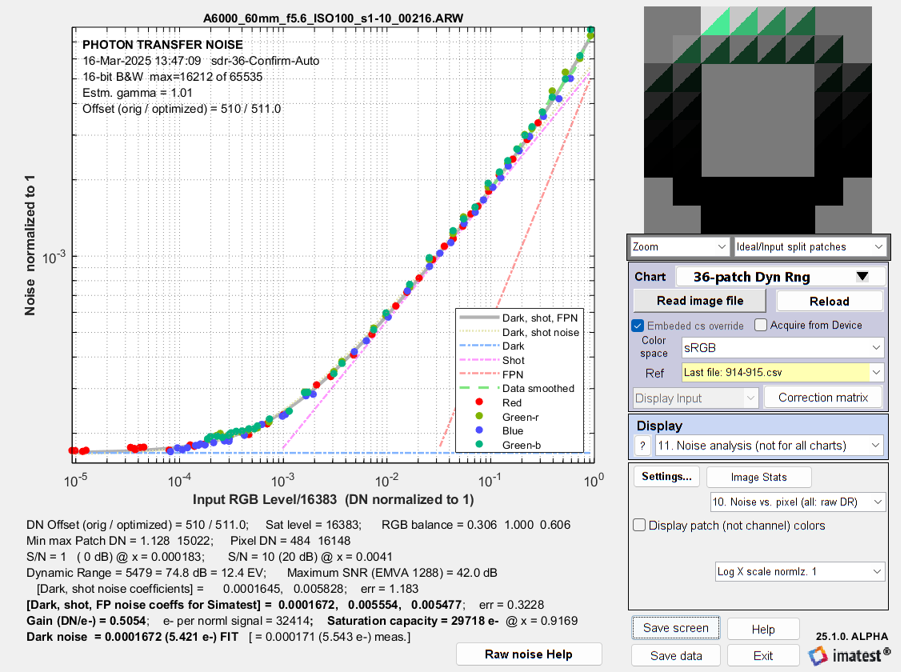
The image sensor noise model can be derived from a photon transfer curve (PTC) [1] obtained from a raw (undemosaiced) image of a transmissive grayscale dynamic range test chart, taking advantage of a valuable property of raw images: the mean value of a flat patch is independent of color.

Photon Transfer Curve (PTC)
The Photon Transfer Curve, shown above, contains the noise in each patch in the chart as a function of the normalized input RGB level (the normalized Digital Number, DNn = DN/DNmax), and a gray line with a very close fit to the data, derived from an equation based on
- the total dark noise, which consists of temporal and DSNU (Dark Signal NonUniformity, i.e., dark fixed pattern) noise,
- the photon shot noise, which tends to dominate the response, and is proportional to the square root of DNn, and
- the PRNU (Photo Response NonUniformity, i.e., light fixed pattern) noise, which is proportional to DNn).
The coefficients for the three noise factors are found with a Levenberg Marquardt optimizer that minimizes an array representing the differences between the individual patch noise minus the curve fit, divided by the individual patch noise.
EMVA 1288-based parameters can also be used to derive the noise coefficients.
- The total dark noise coefficient is the square root of the sum of the squares of the temporal dark noise, DSNU, and dark current noise.
- The photon shot noise coefficient is based on the gain (in DN per electron) and the maximum DN for the camera.
- The PRNU coefficient is PRNU(%)/100.
Camera simulator and information metrics — Input to the simulator consists of ideal test chart images or acquired camera images. Ideal test chart images may be degraded by lens design programs or by blur measured from camera images. The image sensor noise model described above is applied, followed by Image signal processing (ISP).
The output of the simulator is sent to Imatest modules (Rescharts and Color/Tone) that analyze traditional image quality metrics such as sharpness (MTF), noise, SNR, color accuracy, tonal response, and dynamic range, as well as a new set of metrics based on information theory, originally developed by Claude Shannon in 1948 [2]. Information is defined as the resolution of uncertainty, which can be the result from an experiment such as a coin flip or data transmission. The key metric, (Shannon) Information Capacity, SIC, which combines SNR and sharpness (MTF), is the maximum rate that information can pass through a communication channel without error. It is calculated from the Shannon-Hartley equation.
An image is such a communication channel. It can be characterized by SIC in units of bits per pixel. Because it was cumbersome to measure, it failed to gain traction in the imaging industry. In 2022 we discovered a way to conveniently measure SIC and related metrics from the widely used slanted-edge test pattern [3]. We are working with several European universities to correlate SIC with machine vision performance, and we are also working on a standard, ISO 23654. We invite participants.
Summary — We show how a subset of EMVA 1288 image sensor measurements or PTC measurements can be entered into the Simatest simulator and used to calculate camera Information Capacity (SIC) and related performance metrics, which should have a better correlation with machine vision performance than traditional metrics such as sharpness and noise or SNR.
See Also
- Simatest Overview
- [1] J. Janesick, “Photon Transfer DN → λ”, SPIE Press, 2007
- [2] C. E. Shannon, “A mathematical theory of communication”, Bell Syst. Tech. J., vol. 27, 1948
- [3] N. L. Koren, “Image Information Metrics From Slanted Edges: A Toolkit of Metrics to Aid Object Recognition, Machine Vision, and Artificial Intelligence Systems” in Electronic Imaging, 2024, pp 256-1 – 256-17, https://doi.org/10.2352/EI.2024.36.9.IQSP-256
- Image Information Metrics
- ISO 24942 (EMVA 1288)
- EMVA Forum 2025

