We discuss several common image quality measurements that are often misinterpreted, so that bad images are falsely interpreted as good, and we describe how to obtain valid measurements.
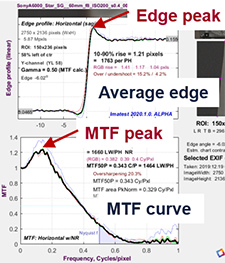
Sharpness, which is measured by MTF (Modulation Transfer Function) curves, is frequently summarized by MTF50 (the spatial frequency where MTF falls to half its low frequency value).
But because MTF50 strongly rewards excessive sharpening, we recommend other summary metrics, especially MTF50P (the spatial frequency where MTF falls to half its peak value), that provide a more stable indication of system performance.
Camera dynamic range (DR), defined as the range of exposure (scene brightness) where the image has good contrast and Signal-to-Noise Ratio (SNR), is usually measured with grayscale step charts. We have recently seen several cases where flare light radiating out from bright areas of the image fogs dense patches, causing unreasonably high DR measurements. This situation is difficult to handle with linear test charts, where the flare light is aligned with the patches, but can be handled well in charts with circular patch patterns, where the patch where pixel level ceases to decrease defines the upper DR limit.
Author: Norman Koren, founder and CTO Presented at Electronic Imaging 2020