Introduction – Spatial frequency units – Summary metrics – Sharpening
Example – Summary
Introduction: The question
We frequently receive questions that go something like,
“How can you compare the sharpness of images taken with different cameras that have different resolutions (total pixel count) and physical pixel size (pitch or spacing)?”
The quick answer is that it depends on the application.
- Are you interested in the sharpness of the image over the whole sensor (typical of most pictorial photography— landscape, family, pets, etc.)? We call these applications image-centric.
- Do you need to measure details of specific objects (typical for medical imaging (we commonly work with endoscopes), machine vision, parts inspection, aerial reconnaissance, etc.)? We call these applications object-centric.
In other words, what exactly do you want to measure?
This page primarily addresses the comparison of object-centric images from different cameras,
where the objects can have very different pixel sizes.
The keys to appropriate comparison of different images are
- the selection of spatial frequency units for MTF/SFR (sharpness) measurements, and
- the selection of an appropriate summary metric (important since the most popular metric, MTF50, rewards software sharpening too strongly).
The table below is adapted from Sharpness – What is it, and how is it measured? We strongly recommend reviewing this page if you’re new to sharpness measurements.
| MTF Unit | Application | Equation |
|
Cycles/Pixel (C/P) |
Pixel-level measurement. Nyquist frequency fNyq is always 0.5 C/P. For comparing how well pixels are utilized. Not an indicator of overall image sharpness. |
|
|
Cycles/Distance (cycles/mm or cycles/inch) |
Cycles per physical distance on the sensor. Pixel spacing or pitch must be entered. Popular for comparing resolution in the old days of standard film formats (e.g., 24x36mm for 35mm film). For comparing Imatest results with output of lens design programs, which typically use cycles/mm. |
\(\frac{MTF(C/P)}{\text{pixel pitch}}\) |
|
Line Widths/Picture Height (LW/PH) |
Measure overall image sharpness. Line Widths is traditional for TV measurements. LW/PH and LP/PH are the best units for comparing the overall sharpness (on the image sensor) of cameras with different sensor sizes and pixel counts. Image-centric. note: for cropped images enter the original picture height into the more settings dimensions input |
\(2 \times MTF\bigl(\frac{LP}{PH}\bigr)\) ; \(2 \times MTF\bigl(\frac{C}{P}\bigr) \times PH\) |
|
Line Pairs/Picture Height (LP/PH) |
\(MTF\bigl(\frac{LW}{PH}\bigr) / 2\) ; \(MTF\bigl(\frac{C}{P}\bigr) \times PH\) |
|
|
Cycles/Angle: Cycles/milliradian |
Angular frequencies. Pixel spacing (pitch) must be entered. Focal length (FL) in mm is usually included in EXIF data in commercial image files. If it isn’t available it must be entered manually, typically in the EXIF parameters region at the bottom of the settings window. If pixel spacing or focal length is missing, units will default to Cycles/Pixel. Cycles/Angle (degrees or milliradians) is useful for comparing the ability of cameras to capture objects at a distance. For example, for birding (formerly called “birdwatching”) it is a good measure of a camera’s ability to capture an image of a bird at a long distance, independent of sensor and pixel size, etc. It is highly dependent on lens quality and focal length. Object-centric. |
\(0.001 \times MTF\bigl(\frac{\text{cycles}}{\text{mm}}\bigr) \times FL(\text{mm})\) \(\frac{\pi}{180} \times MTF\bigl(\frac{\text{cycles}}{\text{mm}}\bigr) \times FL(\text{mm})\) FL can be estimated from the simple lens equation, 1/FL=1/s1+1/s2, where s1 is the lens-to-chart distance, s2 is the lens-to-sensor distance, and magnification M=s2/s1. FL=s1/(1+1/|M|) = s2/(1+|M|) This equation may not give an accurate value of M because lenses can deviate significantly from the simple lens equation. |
|
Cycles/object distance: Cycles/object mm |
Cycles per distance on the object being photographed (what many people think of as the subject). Pixel spacing and magnification must be entered. Important when the system specification references the object being photographed. Cycles/distance is useful for machine vision tasks, for example, where a surface is being inspected for fine cracks, and cracks of a certain width need to be detected. Object-centric. |
\(MTF\bigl( \frac{\text{Cycles}}{\text{Distance}} \bigr) \times |\text{Magnification}|\) |
|
Line Widths/Crop Height |
Primarily used for testing when the active chart height (rather than the total image height) is significant. Not recommended for comparisons because the measurement is dependent on the (ROI) crop height. |
|
|
Line Widths/Feature Height (Px) (formerly Line Widths or Line Pairs/N Pixels (PH)) |
When either of these is selected, a Feature Ht pixels box appears to the right of the MTF plot units (sometimes used for Magnification) that lets you enter a feature height in pixels, which could be the height of a monitor under test, a test chart, or the active field of view in an image that has an inactive area. The feature height in pixels must be measured individually in each camera image. Example below. Useful for comparing the resolution of specific objects for cameras with different image or pixel sizes. Object-centric. |
\(2 \times MTF\bigl(\frac{C}{P}\bigr) \times \text{Feature Height}\) \(MTF\bigl(\frac{C}{P}\bigr) \times \text{Feature Height}\) |
|
PH = Picture Height in pixels. FL(mm) = Lens focal length in mm. Pixel pitch = distance per pixel on the sensor = 1/(pixels per distance). |
||
| Summary Metric | Description | Comments |
| MTF50 MTFnn |
Spatial frequency where MTF is 50% (nn%) of the low (0) frequency MTF. MTF50 (nn = 50) is widely used because it corresponds to bandwidth (the half-power frequency) in electrical engineering. | The most common summary metric; correlates well with perceived sharpness. Increases with increasing software sharpening; may be misleading because it “rewards” excessive sharpening, which results in visible and possibly annoying “halos” at edges. |
| MTF50P MTFnnP |
Spatial frequency where MTF is 50% (nn%) of the peak MTF. | Identical to MTF50 for low to moderate software sharpening, but lower than MTF50 when there is a software sharpening peak (maximum MTF > 1). Much less sensitive to software sharpening than MTF50 (as shown in a paper we presented at Electronic Imaging 2020). All in all, a better metric. |
| MTF area normalized |
Area under an MTF curve (below the Nyquist frequency), normalized to its peak value (1 at f = 0 when there is little or no sharpening, but the peak may be » 1 for strong sharpening). | A particularly interesting new metric because it closely tracks MTF50 for little or no sharpening, but does not increase for strong oversharpening; i.e., it does not reward excessive sharpening. Still relatively unfamiliar. Described in Slanted-Edge MTF measurement consistency. |
| MTF10, MTF10P, MTF20, MTF20P |
Spatial frequencies where MTF is 10 or 20% of the zero frequency or peak MTF | These numbers are of interest because they are comparable to the “vanishing resolution” (Rayleigh limit). Noise can strongly affect results at the 10% levels or lower. MTF20 (or MTF20P) in Line Widths per Picture Height (LW/PH) is closest to analog TV Lines. Details on measuring monitor TV lines are found here. |
Although MTF50 (the spatial frequency where MTF falls to half its low frequency value) is the best known summary metric, we don’t recommend it because it rewards overly sharpened images too strongly. MTF50P is better in this regard, and MTF area normalized may be even better (though it’s not familiar or widely used). Summary metrics are described in Correcting Misleading Image Quality Measurements, which links to a paper we presented at Electronic Imaging 2020.
Sharpening: usually improves image appearance, but complicates camera comparisons
Sharpening, which is applied after image capture, either in the camera or in post-processing software, improves the visual appearance of images (unless it’s overdone), but makes camera comparisons difficult. It is described in detail here. Here are a few considerations.
 Sharpening varies tremendously from camera to camera. Images converted from raw using Imatest’s Read Raw, dcraw, or LibRaw are unsharpened. JPEG images from high quality consumer cameras typically have moderate amounts of sharpening, characterized by limited edge overshoot (visible as halos) and a small bump in the MTF response. But all bets are off with camera phones and other mobile devices. We have seen ridiculous amounts of sharpening— with huge halos and MTF response peaks, which may make images look good when viewed on tiny screens, but generally wrecks havoc with image quality.
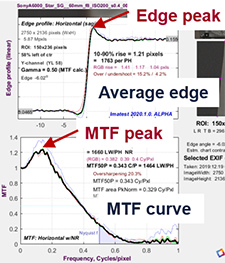
Sharpening can be recognized by the shape of the edge and the MTF response. Unsharpened images have monotonically decreasing MTF. Camera B below is typical. Sharpened images, illustrated on the right (from Correcting Misleading Image Quality Measurements) have bumps or peaks on both the edge and and MTF response. The edge on the right could be characterized as strongly, but not excessively, sharpened.
Sharpening summary — Since different amounts of sharpening can make comparisons between images difficult, you should examine the Edge/MTF plot for visible signs of sharpening. If possible, sharpening should be similar on different cameras. If this isn’t possible, a careful choice of the summary metric may be beneficial. MTF50P or MTF Area Peak Normalized are recommended.
Example: A medical imaging system for measuring sharpness on objects of a specified size
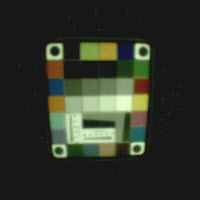
Camera A
Here is an example using the Rezchecker chart, whose overall size is 1-7/8” high x 1-5/8” wide. (The exact size isn’t really relevant to comparisons between cameras.)
The customer wanted to compare two very different cameras to be used for a medical application that requires a high quality image of an object over a specified field of view, i.e., the application is object-centric.
A Rezchecker chart was photographed with each camera. Here are the images. These images can be analyzed in either the fixed SFR module (which can analyze MTF in multiple edges) or in Rescharts Slanted-edge SFR (which only works with single edges).
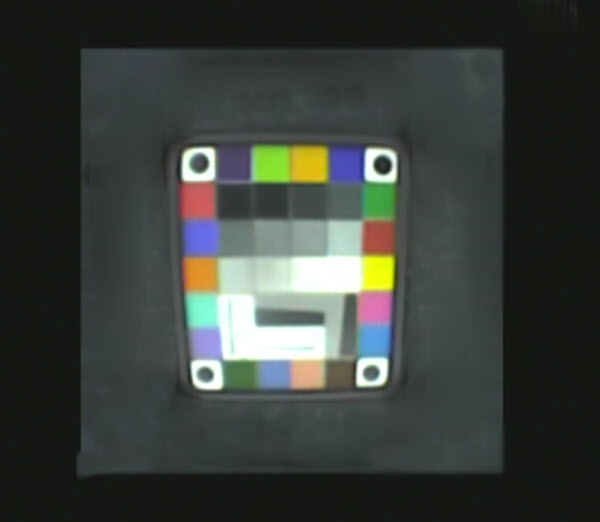
Camera B
Because we don’t know the physical pixel size of these cameras (it can be found in sensor spec sheets; it’s not usually in the EXIF data), we choose units Line Widths per Feature Height. When pixel size is known, line pairs per Object mm may be preferred (it’s more standard and facilitates comparisons). Here is the settings window from Rescharts Slanted-edge SFR.
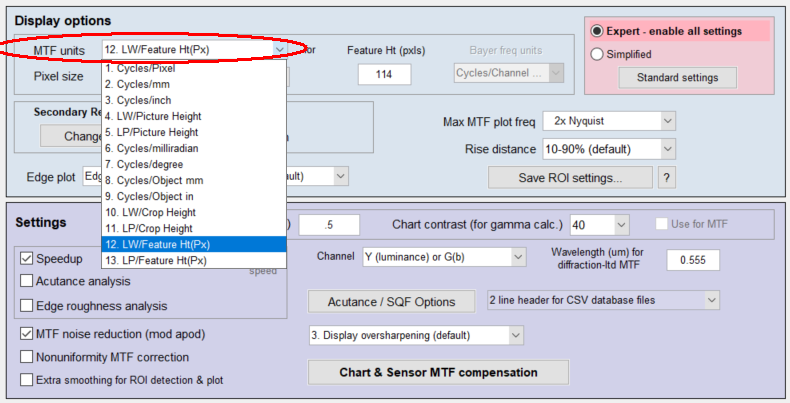 Settings window
The optional Secondary Readouts (obscured by the dropdown menu) are MTF50P and MTF Area PkNorm (normalized to the peak value). Feature Height (114 pixels for camera A; 243 for camera B) has to be measured individually for each image: easy enough in any image editor (I drew a rectangle in the Imatest Image Statistics module and used the height). Entering the feature height for each image is somewhat inconvenient, which is why Cycles/Object mm is preferred (if the sensor pixel pitch is known).
Results of the comparison
The Regions of interest (ROIs) are smaller than optimum, especially for camera A, where the ROI was only 15×28 pixels: well below the recommended minimum. This definitely compromises measurement accuracy, but the measurement is still good enough for comparing the two cameras.
Since there is no obvious sharpening (recognized by “halos” near edges; a bump or peak in the MTF response), the standard summary metrics are equivalent. MTF50 only fails when there is strong sharpening.
For resolving detail in the Rezchecker, camera B wins. At MTF50P = 54.8 LW/Feature Height, it is 20% better than camera A, which had MTF50P = 45.8 LW/Feature Height. Details are in the Appendix, below.
Summary
|
To compare cameras with very different specifications (pixel size; pixel pitch; field of view, etc.) the image needs to be categorized by task (or application). We define two very broad types of task.
Sharpening complicates the comparison. Look carefully at the Edge/MTF plot for visible or measured signs of sharpening. The key sharpening measurement is overshoot. If possible, images should have similar amounts of sharpening. MTF50P or MTF Area Peak Normalized are recommended summary metrics. MTF50 is not recommended because it is overly sensitive to software sharpening and may therefore be a poor representation of the system’s intrinsic sharpness. This is explained in Correcting Misleading Image Quality Measurements. |
Appendix: Edge/MTF results for cameras A and B
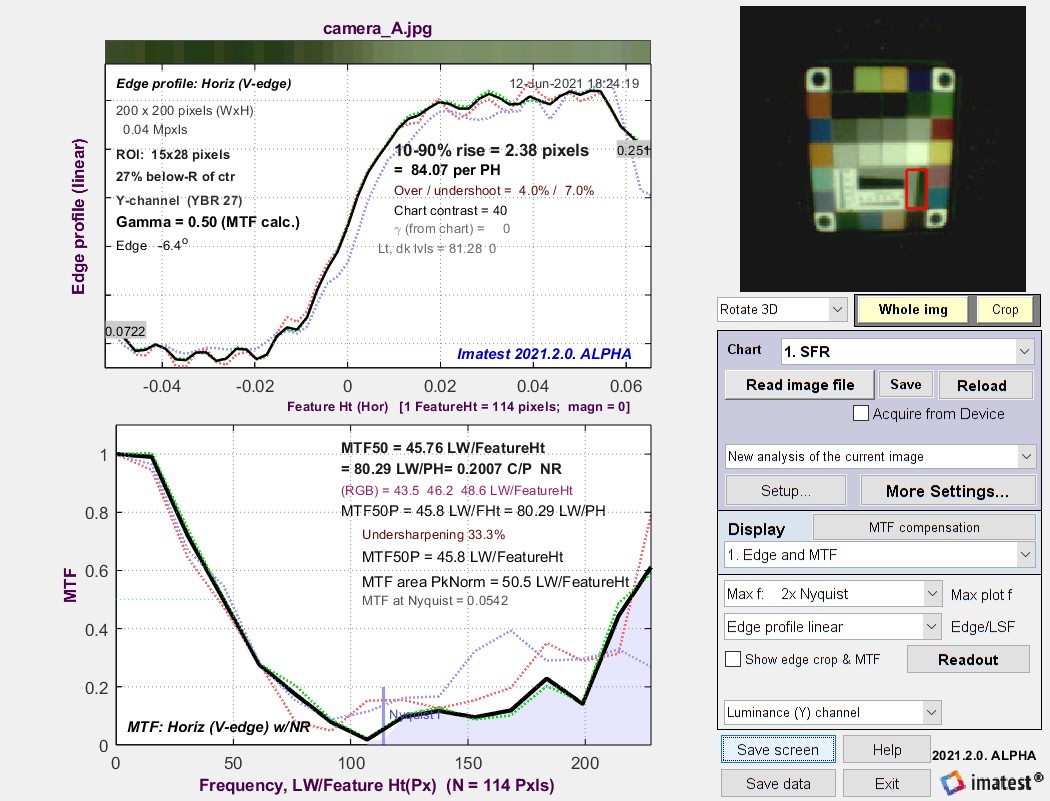
Camera A Edge/MTF results (Click on the image to view full-sized)
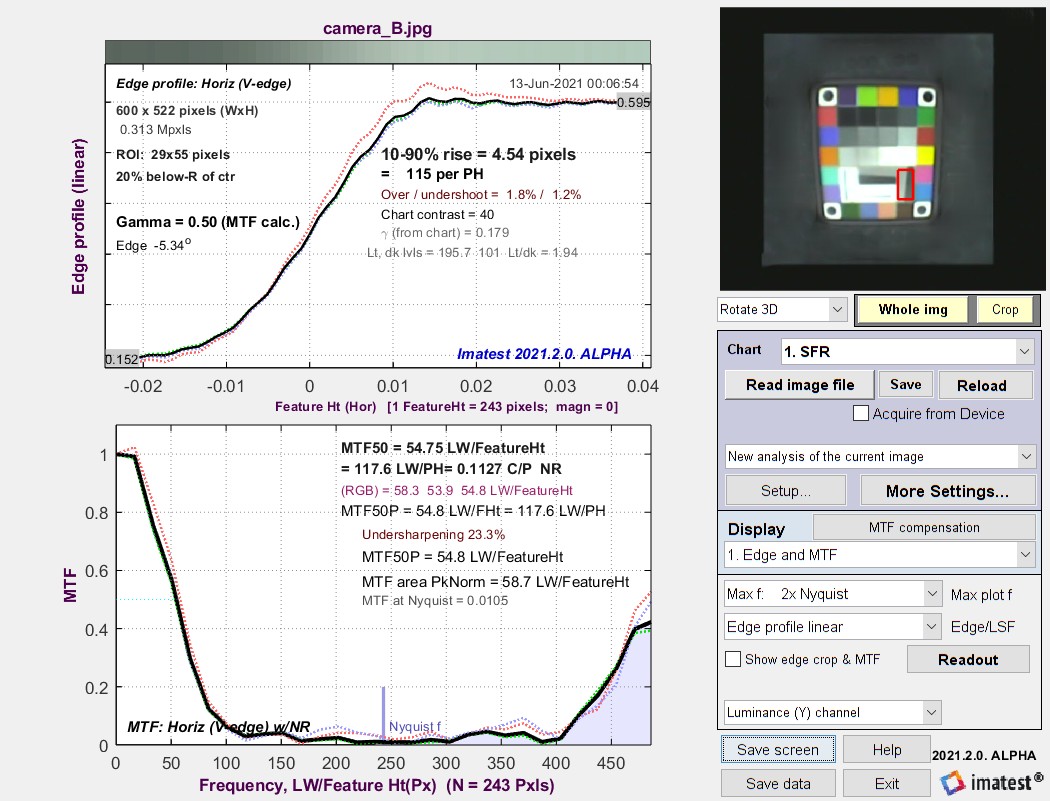
Camera B Edge/MTF results (Click on the image to view full-sized)