We are in the age of Artificial Intelligence that depends on machine vision. This technology surge has necessitated thinking about camera systems in new ways because machine vision systems based on neural networks have different requirements from camera systems intended for human perception.
Norman Koren, Imatest’s founder, has developed a novel approach for evaluating the quality of machine vision systems based on information theory, which is widely used in electronic communications. The image signal and noise (or SNR) are entered into the Shannon-Hartley equation to calculate Information capacity, which is the maximum amount of information that can pass through a channel (i.e., the camera system) without error. Simply put, it is a measure of a camera’s “goodness.” By measuring the signal and noise from the same slanted edge region of an image, greater understanding can be gained for a camera system’s fundamental capabilities and potential performance. Traditional measurements such as SNR and MTF50 by themselves are not indicative of the fundamental image information, and hence they are insufficient to derive machine vision performance metrics such as detection confidence levels.
At Imatest, we are working with partners in industry and academia to validate the ties between a camera system’s image information metrics and its machine vision capabilities., which are based on the AI models that are trained for the system’s camera captures. We want to highlight the University of Galway (Ireland) research group led by Dr. Brian Deegan, whose lab is part of The Connaught Automotive Research (CAR). They have looked closely at the information capacity numbers for a variety of camera parameters and the metric correspondence to machine vision performance.
Figure 1 shows the simulation chart used in the Deegan et al. research, which contains sets of four different sizes of simulated people (used as the test objects) and a slanted edge used to make the information capacity measurements. A series of images with various degradation levels of contrast, Gaussian blur, and Poisson noise were generated and evaluated using a YoloV10m model. The confidence interval of object detection was obtained as a performance measurement of the model.
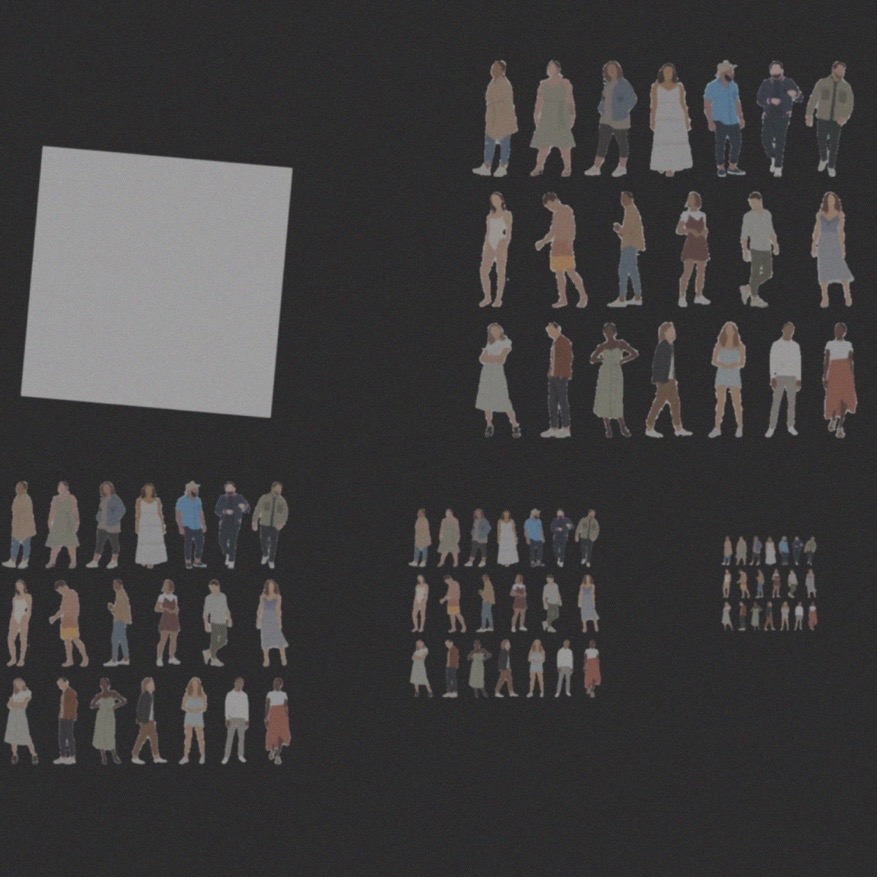
Figure 1. A simulated test chart used for the Deegan et al. research that contains four specific sets of differently sized people
(Very large, Large, Medium, and Small) for quantifying the machine vision performance and a slanted square
with edges used for quantifying the traditional image quality metrics and new image information metrics.
Figure 2 shows the relationship between machine vision performance and a traditional image quality metric, MTF50. For this plot, the correlation of the model’s average confidence with MTF50 is low overall, which indicates the shortcoming of traditional metrics. Note that the data points with zero average confidence are the results for the small people category, which were too small to be detected by the machine vision model.

Figure 2. Machine Vision confidence versus MTF50. for a test chart with four specific sizes of people
(Very large, Large, Medium, and Small). This graph shows that the machine vision model‘s confidence levels and MTF50
are poorly correlated. Note: The data points with zero average confidence are the results for the small people category,
which were too small to be detected by the machine vision model.
Figure 3 contains a similar comparison between machine vision model confidence and the new Shannon image information capacity metric (SIC in the figure). The correlation between the machine vision model confidence and the new information capacity is high. The green, yellow, red, and blue data points are for the very large, large, medium and small categories of people size, respectively. The small people (blue) were too small to be detected These sets of data indicate that information capacity can be used as a good metric for characterizing the machine vision that is part of AI.
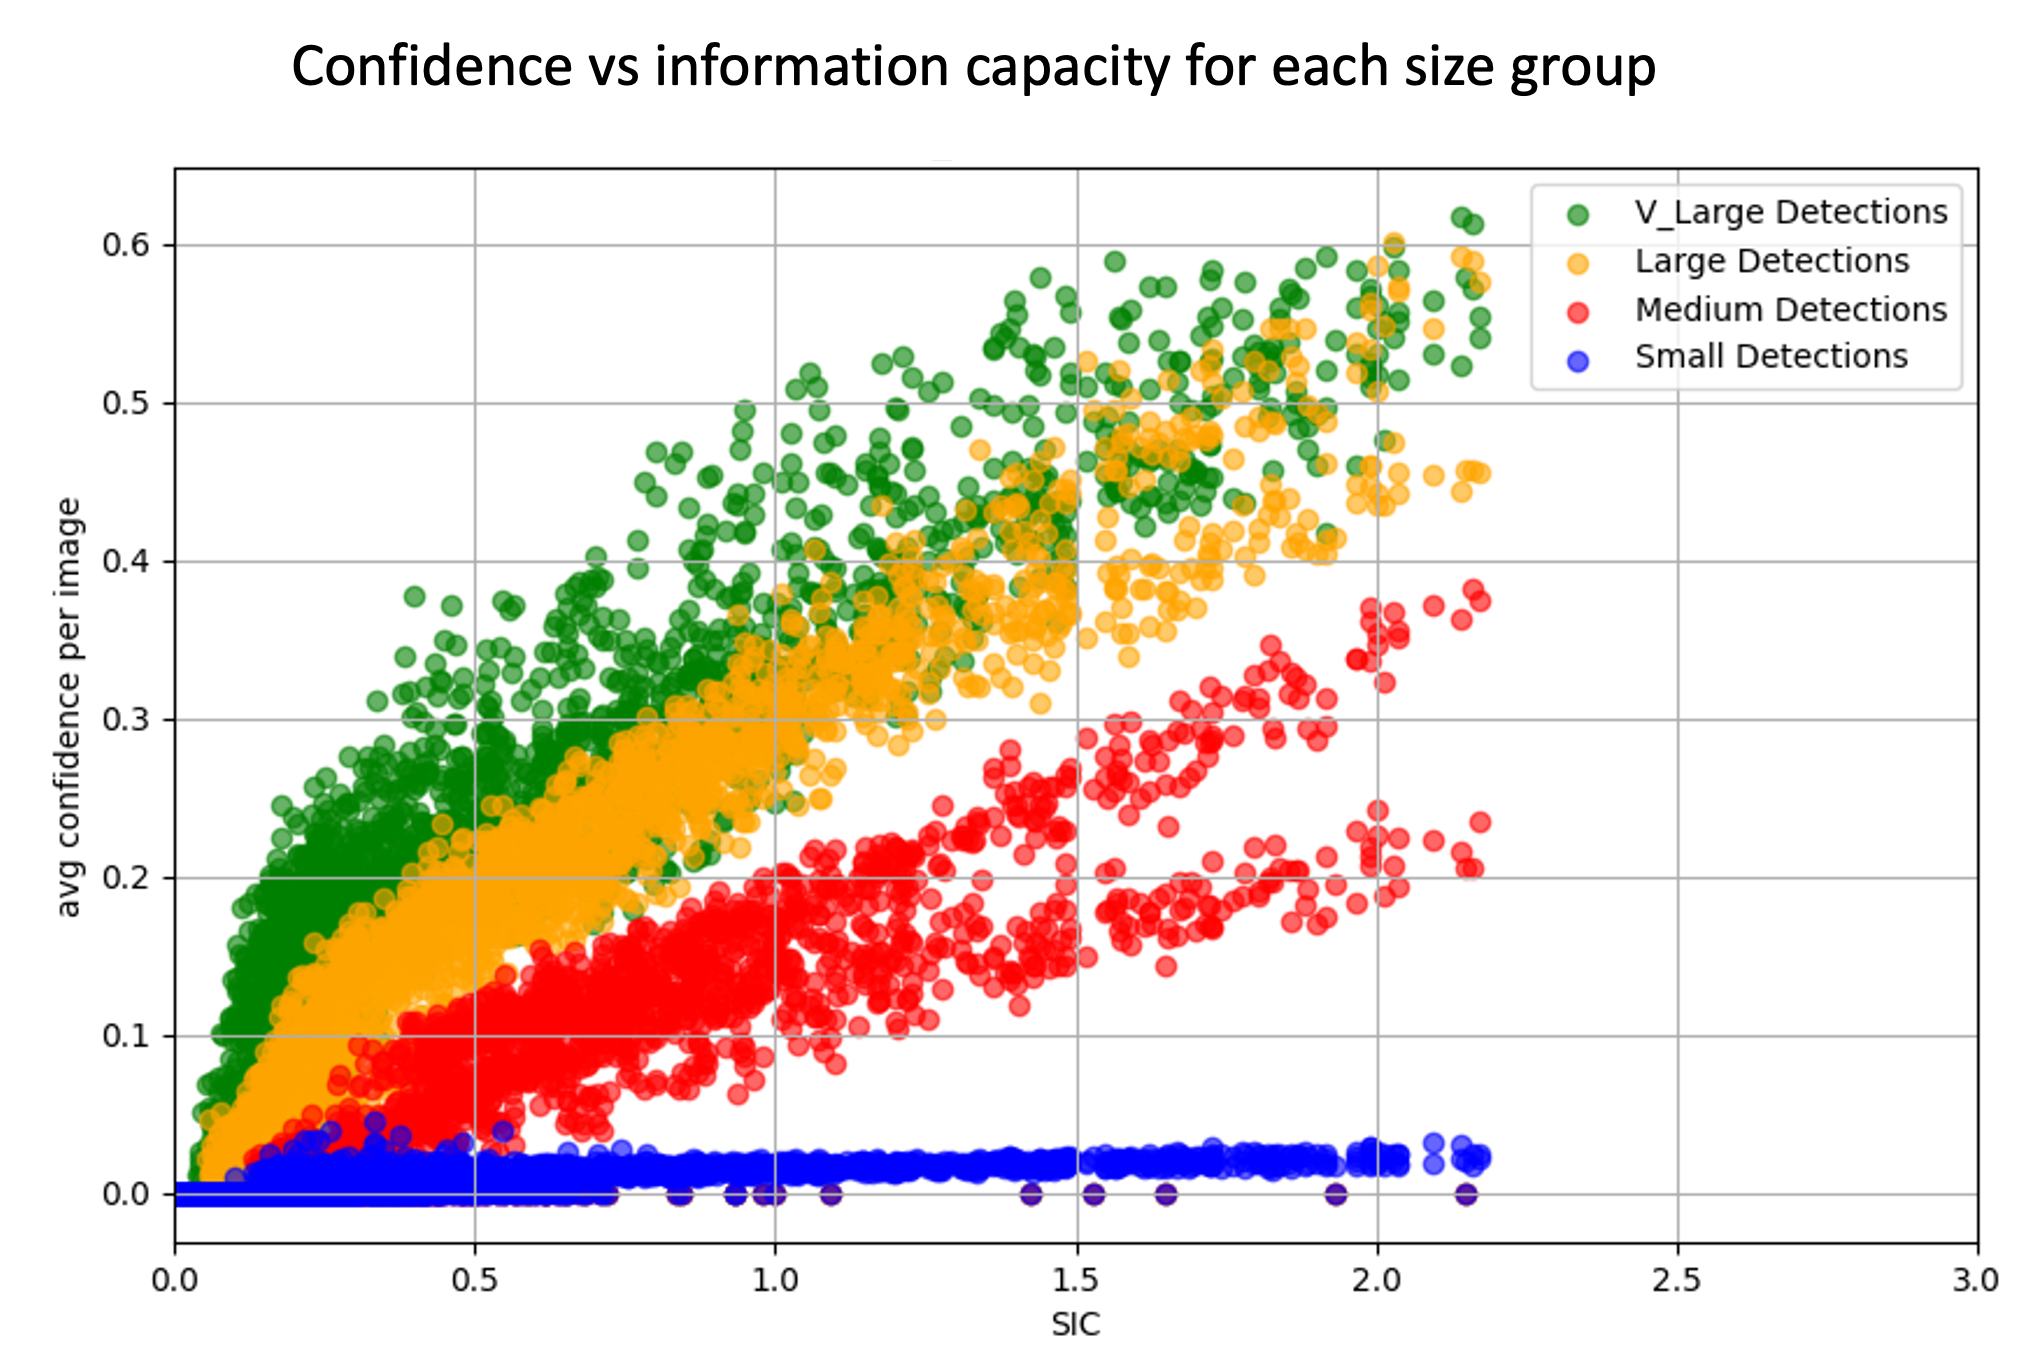
Fig. 3. Machine Vision confidence versus Information Capacity. for a test chart that has four specific sizes of people
(Very large, Large, Medium, and Small), this graph shows that the machine vision model‘s confidence levels
correlate well with the Shannon information capacity (SIC) for each grouping of people size detection
(with the exception of the detection of small people, which were too small to be detected by the machine vision model).
Imatest continues to work with our partners in academia and industry to further validate the image information metrics. In addition, we are leading the effort in the ISO/TC42 Photography standards body to bring these metrics into a new standard, ISO 23654 Image Information Metrics. This effort is currently in the new work initiative stage.
If you would like to collaborate with Imatest on the validation and standardization of image information metrics, reach out to us at [email protected]. You can also try out the image information metrics directly by using our Imatest analysis software, which has the metrics included in our newer releases. See more details at imatest.com/imaging/image-information-metrics/.
Future Work
- Complete the publication of the study that is summarized above.
- Study the correlation between detection confidence and additional image information metrics, including ideal observer SNR (SNRi) and Edge Location Sigma.
- Perform real-world camera tests instead of simulations.
- Examine various filtering methods to determine if they improve object detection performance.
- Simulate or reproduce other failure modes in an imaging lab and consider their impact on object detection and image quality (IQ) metrics.
See Also
- Image Information Metrics (Imaging Page)
- Correlating the Performance of Computer Vision Algorithms with Objective Image Quality Metrics (H.Koren 2022)
- Image information metrics from Slanted edges: Instructions
- Image information metrics from Slanted edges: Equations and Algorithms
- Shannon information capacity from Siemens stars
