Interactive Analysis of Resolution-Related Charts
|
New in Imatest 2020.1 : Shannon information capacity from Siemens Star charts |
Introduction – Supported charts – SFR – SFRplus – eSFR ISO – SFRreg – Checkerboard
Getting Started – Rescharts Window – Rescharts modules
Slanted-edge SFR – SFRplus – Log frequency (simple) – Log frequency-contrast – Star – Wedge
Random/Dead Leaves – Focus Score
Introduction
Imatest™ Rescharts is a highly-interactive interface for running several Imatest modules that can analyze images of several different test charts for resolution-related parameters such as sharpness (i.e., Spatial Frequency Response SFR, which is equivalent to Modulation Transfer Function MTF), color moiré, and fine detail lost to software noise reduction.
| All Rescharts modules can read images from image files (raw and interchangeable) ♦ via direct data acquisition from a variety of devices |
Several chart types are used for analyzing cameras because most cameras for the consumer market have nonlinear (non-uniform) signal processing, i.e., they behave differently near contrasty edges (where sharpening, i.e., high frequency boost, tends to be maximized) than in finely textured regions (where noise reduction, i.e., high frequency cut, tends to be maximized). For a detailed explanation see MTF Measurement Matrix.
All Rescharts modules (Slanted-edge SFR, SFRplus, eSFR ISO, SFRreg, Checkerboard, Log F-Contrast, Star chart, Wedge, Random/Dead Leaves, and Find Sharpest Files/Focus Score) are available as fixed modules that can operate in batch mode. These modules have buttons on the redesigned Imatest main window.
Supported chart types
Slanted-edge SFR |
|||||||
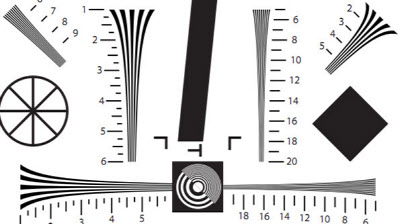
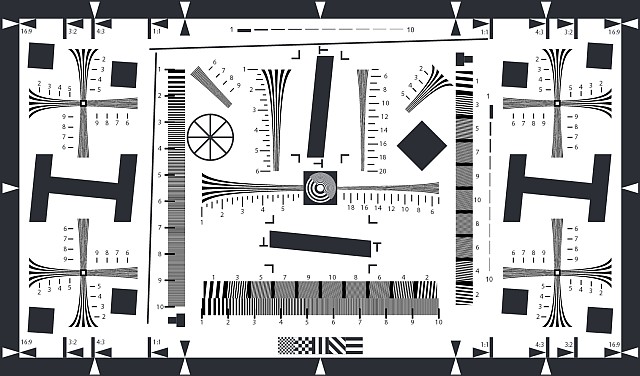 Slanted-edge SFR supports any chart (such as ISO 12233:2000) that contains slanted-edges. Slanted-edge SFR supports any chart (such as ISO 12233:2000) that contains slanted-edges. |
Slanted-edge SFR largely duplicates SFR. Only a single edge can be analyzed, but it has a highly interactive interface. It calculates and displays the average edge, SFR (Spatial Frequency Response or MTF), Lateral Chromatic Aberration, Subjective Quality Factor (or Acutance), noise (in the Region of Interest), and edge roughness.Any chart that contains slanted edge patterns is supported, including the old and new ISO-12233 charts. Charts may be purchased from the Imatest Store or created with Test Charts and printed on a high quality inkjet (requires skill). If you are just getting started with MTF testing we recommend using the SFRplus or eSFR ISO charts (shown below), which have numerous advantages over other slanted-edge charts, especially the old high-contrast ISO-12233:2000 chart. | ||||||
SFRplus |
|||||||
 SFRplus chart SFRplus chart |
Highly automated analysis of SFR (MTF), Lateral Chromatic Aberration, distortion, tonal response, color response, and several additional factors. Uses a special test chart. Unlike other Rescharts modules, SFRplus detects regions (ROIs) automatically. Running SFRplus in Rescharts saves settings for fully automated runs that can analyze batches of images.Several types of SFRplus test chart are available in the Imatest Store. Media include inkjet (large charts), photographic paper, photographic film, or chrome on glass. There are options for the grid pattern (5×7 or 5×9 squares), contrast (4:1 is recommended for new projects), and an optional color pattern. |
||||||
eSFR ISO |
|||||||
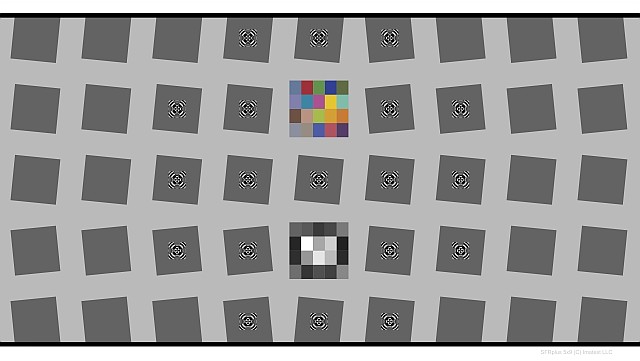
 eSFR ISO chart (Enhanced version) eSFR ISO chart (Enhanced version)Operation is very similar to SFRplus. |
Highly automated analysis of SFR (MTF), Lateral Chromatic Aberration, distortion, tonal response, color response, several varieties of noise, wedge MTF and aliasing, and more. Uses Imatest’s versions of the ISO 12233:2014 Edge SFR (E-SFR) test chart (which is compliant with the standard), shown on the left. Like SFRplus, eSFR ISO detects regions (ROIs) automatically. Running eSFR ISO in Rescharts saves settings for fully automated runs that can analyze batches of images.Several types of eSFR ISO test chart are available in the Imatest Store. Media include inkjet (large charts), photographic film, photographic paper (much higher resolution than inkjet), and chrome on glass. Options include the Standard chart with no extra features, the Enhanced chart (shown on the left), and the Extended chart with a 16:9 aspect ratio, making it suitable for HDTV and cinema work. |
||||||
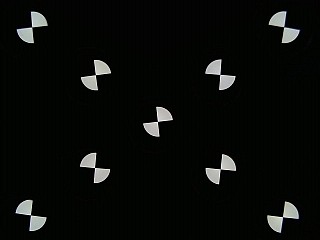
SFRreg
Log Frequency (simple) |
|||||||
 Log frequency chart Log frequency chart |
Analyzes a sine or bar pattern of increasing spatial frequency. Measures SFR more directly, but less precisely, than the slanted-edge method. Also measures color moiré (Imatest Master only), which is a function of lens sharpness, anti-aliasing filter, and demosaicing algorithm. Spatial frequencies are detected automatically. Charts can be created by Test Charts and printed on a high quality inkjet printer. Also works with the old test chart in Lens testing. |
||||||
Log F-Contrast (not in Imatest Studio) |
|||||||
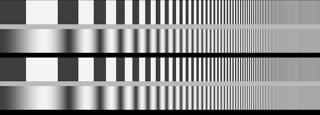
 Log Frequency-Contrast chart Log Frequency-Contrast chart |
Log F-Contrast (Imatest Master only) analyzes a sine or bar pattern of increasing spatial frequency on the one axis and decreasing contrast on the other. Measures SFR for a range of contrast levels. Useful for measuring the loss of fine detail caused by software noise reduction— the effects of nonlinear (nonuniform) signal processing. The chart can be purchased from the Imatest store or can be created by Test Charts and printed on a high quality inkjet printer. In Imatest 4.0+, a version of the chart that includes registration marks supports automatic ROI detection. Log F-Contrast instructionsSharpness & Texture Analysis from Imaging-Resource |
||||||
Star chart (not in Imatest Studio) |
|||||||
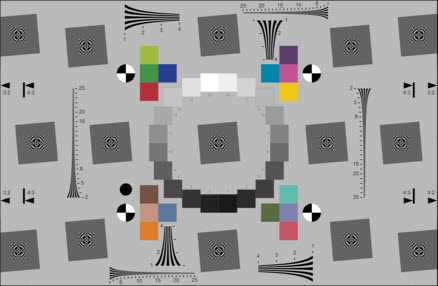
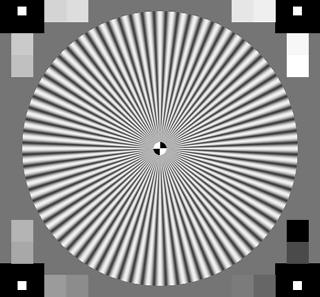 Siemens Star chart |
Analyzes a sinusoidally-modulated Siemens star chart (144, 72, or 48 cycles); proposed for the revised ISO 12233 standard. Measures MTF (SFR) for 8, 12, or 24 segments around the circle. Has a large variety of displays. The chart can be created by Test Charts and printed on a high quality inkjet printer. In Imatest 4.0+, a version of the chart that includes registration marks supports automatic ROI detection. |
||||||
Wedge (not in Imatest Studio) |
|||||||
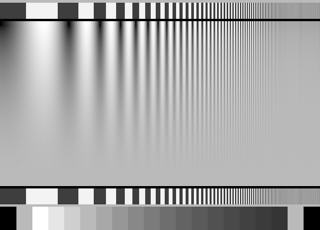
 ISO 12233 chart (crop showing wedges)
|
Analyzes hyperbolic, logarithmic, or trapezoidal wedge patterns (converging bars with linear or logarithmic frequency or linear spacing) contained in the ISO 12233:2000, ISO 12233:2014, EIA 1956, and other test charts. Measures MTF (SFR) and the onset of aliasing (similar to the CIPA DC-003 standard). eSFR ISO measures wedges in Imatest’s versions of ISO 12233:2014 charts with fully automated region detection. |
||||||
Random / Dead Leaves / Spilled Coins (not in Imatest Studio) |
|||||||
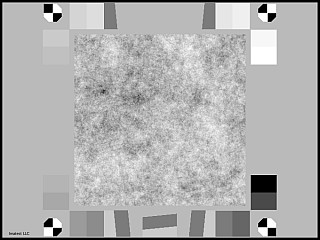 Scale-invariant random test chart Scale-invariant random test chart “Spilled Coins” (Dead Leaves) chart “Spilled Coins” (Dead Leaves) chart |
Random / Dead Leaves (Imatest Master only)Analyzes random (scale-invariant) patterns, which have a 1/f fourier transform (1/f 2 Power Spectral Density (PSD)). (Patterns with slightly different spectra can also be analyzed.) Such patterns have the same general appearance (the same statistics) regardless of distance. Imatest supports two patterns of this genre: the random scale-invariant pattern (shown on the left) and Dead Leaves pattern (Imatest’s highly scale-invariant version is called “Spilled Coins“.Since images of the random pattern typically have little sharpening (due to the lack of contrasty edges) but relatively large amounts of noise reduction, it is an excellent indicator of a camera’s ability to render fine low-contrast detail. Images of the Spilled coins/Dead leaves pattern have some edges, making them representative of “average” images. (Slanted-edges, by comparison, tend to be highly sharpened and hence give little indication of a camera’s response to fine low-contrast detail.) Noise power measured in the smooth outer regions, is subtracted from the PSD of the random pattern. Low contrast slanted-edges are used to used to verify the random pattern results. Starting with Imatest 4.0, automatic region detection is available for the TE265 Dead Leaves and Imatest Spilled coins charts.Random / Dead Leaves instructions |
||||||
Focus Score (formerly Any Image Sharpness; not in Imatest Studio) |
|||||||
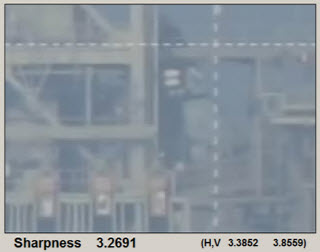 Image used for Any Image Sharpness |
Measures sharpness of any scene. The sharpness metric is nonstandard and applies to the individual scene only (it cannot be used for comparisons with other scenes). (It’s the same metric used in Find sharp files.) Useful for optimizing focus during reloads using direct acquisition of frames from live (video) feeds. Displays the image and a history showing changes in sharpness as the device is focused. |
||||||
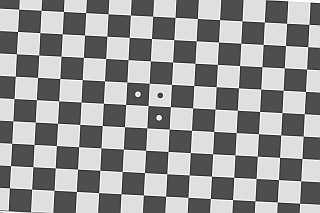 Checkerboard chart
Getting started
Most of the charts described on this page can be purchased from the Imatest store, and many can printed from files created in Test Charts (good equipment and skill required).
Photograph or scan the chart, taking care to avoid glare, which can be problematic in charts with semigloss and glossy surfaces. Glare can be especially difficult to control with wide angle lenses (matte charts are recommended for SFRplus). A recommended lighting setup is described here and in Building a Low-Cost Test Lab.
To start Rescharts, run Imatest, then click the button. The Rescharts window will appear with brief instructions, which may be more up-to-date than the ones shown below.
 Rescharts opening window, with brief instructions
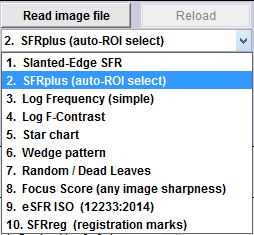
Select an image to analyze by
- clicking on if the correct Chart type is displayed, or by
- clicking on one of the entries in the Chart type dropdown menu.
The button and Chart type popup menu are highlighted (yellow background) when Rescharts starts.
A standard Windows dialog appears with the chart type indicated in the title. Open the image file. Multiple files can be opened for averaging (but batch (sequential) runs are not supported in Rescharts).
If the folder contains meaningless camera-generated file names such as IMG_3734.jpg, IMG_3735.jpg, etc., you can change them to meaningful names that include focal length, aperture, etc., with the Rename Files utility, which takes advantage of EXIF data stored in each file.
For modules other than SFRplus, eSFR ISO, SFRreg or Checkerboard, if the image is the same pixel size as an image previously analyzed by Rescharts (up to 20 recent file settings saved), you’ll be asked if you want to use the same ROI (region of interest). (ROI selection is entirely automatic with SFRplus, eSFR ISO, and SFRreg.)
 ROI repeat dialog box, shown zoomed in
If the image size or type is different or if you answer No, a coarse cropping box appears. The initial crop doesn’t have to be precise: you’ll have a chance to refine it.
- For Slanted-Edge SFR, select the region you want. Recommended cropping.
- For Log Frequency (simple), select a narrow strip running from along the direction of increasing spatial frequency. Narrow strips of the Log Frequency-Contrast chart can be used.
- For Log F-Contrast, select most of the chart image excluding the bar patterns at the top and bottom, leaving small margins (1/2 to 1% of the image dimensions) at the edges.
- See the individual instruction pages for Star chart, Wedge, and Random (scale-invariant).
After the rough crop has been selected, the fine adjustment box appears, showing the coarse crop as a rectangle. This dialog box can be enlarged or maximized to facilitate the adjustment. It offers numerous options.
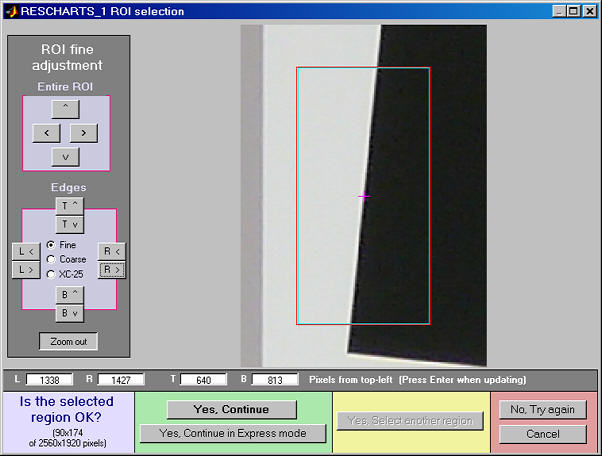
ROI fine adjustment dialog box for SFR. A more complex box may appear for other modules.
- The entire ROI can be moved ( , upper-left).
- The top, bottom, left, or right sides can be moved ( , middle-left).
- You can choose between Fine, Coarse, and Extra Coarse movement (1, 5, or 25 pixels of movement per click).
- The display can be zoomed out or in.
- Pixel values for the four corners can be entered (X(tl), Y(br), …, where tl = top-left, br = bottom right, etc.). The origin is the upper-left. Be sure to press the Enter key after entering a value.
When you have completed the fine adjustment, click one of the buttons on the bottom of the window. If you click , an additional dialog box will appear. The entries in this dialog box can be changed later by clicking on in the Rescharts window. If you click , it will go directly to the Rescharts window, using saved values.
The Rescharts window
After the image file has been entered, calculations are performed and the most recent Chart view is displayed. The normalized MTF/contrast (2D pseudocolor contour) display for Log F-Contrast is shown below.

MTF contours for the Panasonic G3 compact system camera, showing how contrast affects MTF.
Downloaded from Imaging-Resource.com (a great resource:
Find the camera review, click on Samples, then scroll down to Multi-target.)
The main display image is on the upper left. Additional text results may appear below this image. An image of the chart is shown on the upper right. You can choose to display the whole image or the crop (ROI). The remainder of the right side is the control area.
The Zoom dropdown menu (below the thumbnail on the upper-right) lets you choose between Zoom (double-click on the image to restore the original magnification), Rotate 3D, and Data cursor (a useful function that lets you examine numerical values at the point of interest).
The buttons to the right of Zoom set the display to either the or a of the image (the selected ROI).
Image and Display areas

Display options
The image area on the right of the Rescharts window, includes the the and buttons, the Chart type dropdown menu (described above), and additional controls.
reloads an image from a file or reacquires it from a device or video stream (depending on how the image was originally acquired).
Immediately below the Chart type menu is the New analysis (same image) button and menu. When the button is pushed or an item is selected on this menu, the image is recropped for analysis by the selected chart type (which may be the same or different). This menu is useful when several regions of an image need to be analyzed or when the target contains more than one chart type.
brings up the input dialog box for the selected chart type. This is the same box that appears when you press (not Express mode) in the ROI repeat or ROI selection window.
Display, immediately below the image area, selects the results to display. Choices depend on the chart type.
The Display options area is immediately below Display. The contents, which depend on the Display selection, are described below in the sections for the individual displays.
(shown on the right) saves a snapshot of the current display (the entire Rescharts screen) as a PNG file (a widely-used losslessly-compressed format). It also allows you to immediately view the snapshot (if the Open window… box is checked) so it can be used a reference for comparing with other results.

File name and Directory at the top of the window set the location of the file to save.
When you check the Open window in an image viewer… box, the current screen will be opened either the system default viewer (if the box under Image viewer is blank) or a viewer/editor of your choice (if the box contains the path name to the viewer/editor). We recommend Irfanview, which is fast, compact, free, and supports an amazing number of image file formats. (It can be valuable for converting nonstandard images to Imatest-readable formats.) Its normal location in English language installations is C:\Program Files\IrfanView\i_view32.exe. FastStone viewer is also an excellent choice.
Saves detailed results in CSV, XML, and/or JSON formats. The exact content depends on the module.
opens this web page in an HTML browser window.
terminates Imatest Rescharts and returns to the Imatest main window.
Rescharts utilities
Numerous helpful utilities are available from the Rescharts window. We present the highlights from the dropdown menu (omitting items that have their own buttons). The dropdown menu has the following entries:
|
File
|
Save image file | Saves the image under test in a named file. Useful for the Image Sensor version, where images may be acquired directly from devices. |
| Copy screen | Copies the screen to the clipboard. Paste may not work in all applications. | |
| Copy image | Copies the image under test to the clipboard. Paste may not work in all applications. | |
| Copy image file name | May be useful in reports. | |
| Copy image file path | Can be pasted into Windows Explorer. | |
| Explore image file folder | Opens Windows Explorer for the image file folder. | |
| Explore recent save folder | Opens the recent save folder. Very useful for viewing saved results. | |
| View all EXIF data | Opens a separate window with EXIF (meta)data for the file under test. Exiftool must be installed. | |
|
Settings
|
Read raw setup | Set up parameters to read manufacturer’s (unpacked) raw files. Described here. |
| Small… Fonts | Set font size. Useful when Rescharts window is displayed large for demonstrations. | |
| Show annotation box | Replaces a portion of the Display area with a box where you can type text to describe screen images (use with Save screen). Close with Close button on lower right. | |
| Annotation box- last setting |
Opens the Annotation box with the last (saved) setting. | |
| Save 3D view | Save the current 3D view (angle) for the next time a 3D plot is opened. | |
| Default 3D view | Restore the default 3D view angle. | |
| AGC 16-bit MTF files | Auto adjust levels for MTF analysis of 16-bit (48-bit color) files. Helps when files are too dark. | |
|
INI File |
These utilities allow you to manipulate the ini file, which is the file where settings are saved. rescharts.ini (where saved settings are stored) has been merged into imatest-v2.ini, which is now compatible with non-Latin characters (Asian languages) They are listed in Saved settings. | |
| Chart configuration |
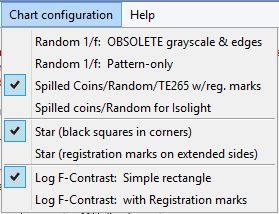 Set Chart configuration for Random/Dead Leaves, Star, or Log F-Contrast. They affect the region selection (chart layout, location of grayscale patches, registration marks, etc.). The proper setting should be made before reading the file. |
|
|
Help
|
Online Help | Opens this web page, Using Rescharts. |
| Register | Opens the Imatest (Nalpeiron) License manager. | |
| About | Opens the About Imatest page, which contains the version, build date, and links to Registration programs. | |
| Using [module, etc.] | Opens web pages with instructions for the various Rescharts modules. | |
Modules
This section describes the Rescharts modules in more detail, illustrating some of the available displays and options. Note that most of these also function as fixed (batch-capable) modules. More information is available in the pages for the individual modules (Chart typea-s).
Slanted-edge SFR
|
Slanted-edge SFR measures sharpness as Spatial Frequency Response, also called MTF (Modulation Transfer Function) from images of slanted edges. ROI (Region of Interest) selection, calculations, and output largely duplicate SFR. Available displays
The principal differences from SFR are the highly interactive interface and the limitation that only one ROI can be displayed. In the histogram of ROI levels, shown below, Black is the entire ROI. Cyan is the portion on the left and red is the portion on the right, both away from the edge. The upper histogram is for the original image (pixel levels/255); the lower histogram is for the linearized image (gamma applied). |
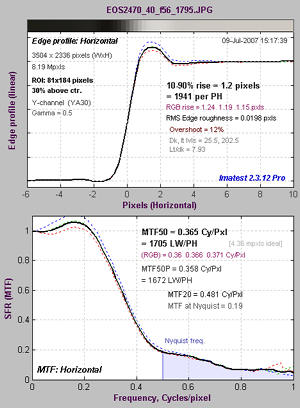
SFR Edge and MTF display |
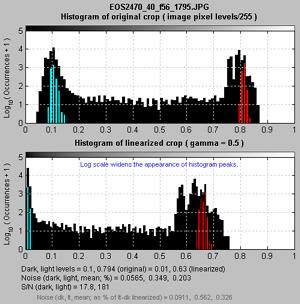
SFR Histogram |
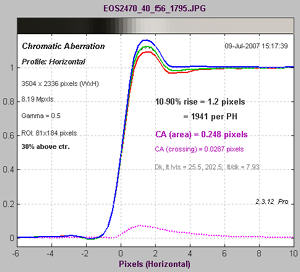
SFR Lateral Chromatic Aberration |
SFRplus, eSFR ISO, SFRreg, and Checkerboard
| These four modules perform a highly automated analysis of SFR (MTF) and lateral chromatic aberration. All but SFRreg measure optical distortion. SFRplus and eSFR ISO also measure tonal and color response. Test charts for all four modules are available in several different sizes and media. Unlike other Rescharts modules,these modules do not require manual region (ROI) selection: it is performed automatically, based on user settings. Settings are saved for fully automated runs, which are invoked by pressing the appropriate button, e.g., , in the Imatest main window.. | Available displays: Full instructions
|
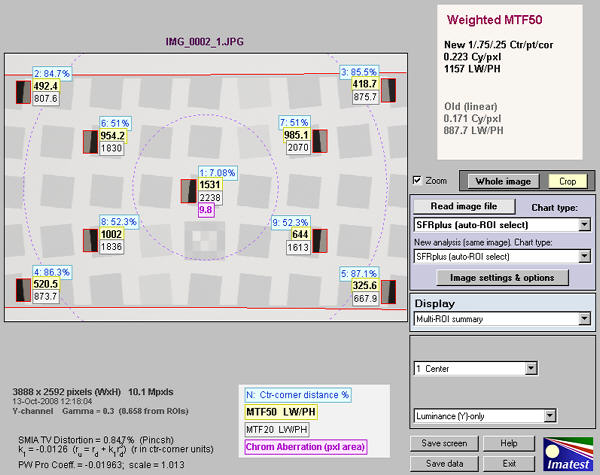
SFRplus multi-region summary display for 9 automatically-selected regions
|
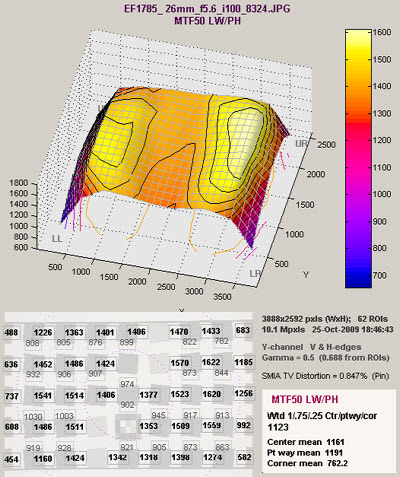
3D plot of MTF50 (many results available) |
Lens-style MTF plot: Similar to plots |
Log Frequency (simple)
![]()
Log frequency image: right-click to download an image that can be used for testing.
Log Frequency measures image contrast of sinusoidal charts that increase in spatial frequency on a logarithmic scale (log frequency increases with x). For a sinusoidal image pattern (not a bar pattern) the contrast is equivalent to SFR or MTF. This method is more direct than Slanted-edge SFR, but less accurate because it is degraded by noise and sampling phase variation— and it requires a lot more real estate. It also measures color moiré (Imatest Master only). The chart can be created by Test Charts and printed on a high quality inkjet. Also works with narrow strips of the Log Frequency-Contrast chart.
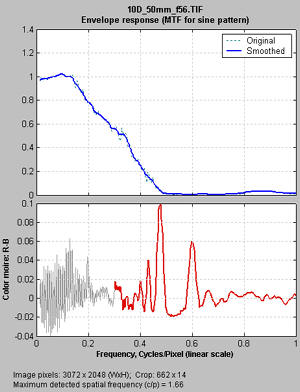
Log Frequency MTF and moire display
(linear x-axis frequency scale)
Available displays: Full instructions
| The Pattern (original pixel levels and linearized) |
| MTF and Moire (linear frequency scale) |
| MTF and Moire (log frequency scale) |
| EXIF data |
The display on the right shows Contrast (MTF) on the top and color moire on the bottom as a function of spatial frequency (displayed linearly). Color moire can me measured in several ways: R-B (normalized Red − Blue channel) is shown on the right. The total color moire is the spread of values above 0.3 cycles/pixels (indicated by the red curve). Details of the color moire measurement can be found in Log Frequency. The Correct for color density box should be checked for best results.
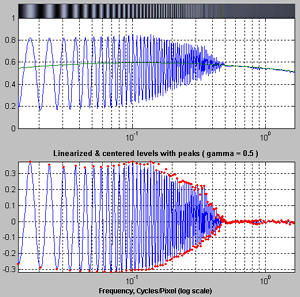
Pattern (original pixel levels and linearized)
Log F-Contrast
|
Log F-Contrast (short for Log Frequency-Contrast) measures the image contrast of charts that vary in spatial frequency on one axis (log frequency increases with x) and in contrast on the other (contrast is proportional to ( y/h)2 for image height h). When the image pattern is sinusoidal (rather than a bar pattern) the contrast is equivalent to SFR or MTF. This module can be used to measure how much fine, low-contrast detail is lost to software noise reduction. The chart can be created by Test Charts and printed on a high quality inkjet printer. Available displays: Full instructions
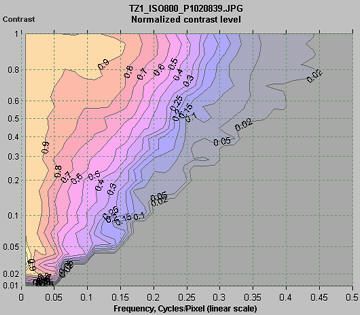
The displays on the right show the Normalized contrast level (MTF normalized to 1 at low spatial frequencies for all chart contrast levels) for the Panasonic TZ1 camera with ISO speed set at 80 (top) and 800 (bottom). Spatial frequency is on a linear scale with a maximum displayed frequency of 0.5 cycles/pixel. The difference between the two images is quite striking. The TZ1 has much more noise reduction— and correspondingly less detail— at ISO 800. These plots are explained in detail in Log F-contrast.
|
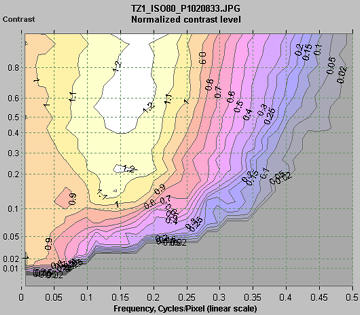
Normalized contrast level (MTF)
Normalized contrast level: TZ1, ISO 800 |
Star chart
|
Star Chart measures contrast (MTF or SFR) of sinusoidally-modulated star charts (also known as the Siemens star) proposed for inclusion in the updated ISO 12233 standard. Charts have 144, 72, or 48 cycles and can be analyzed in 8, 12, or 24 segments. Star charts can be created by Test Charts and printed on a high quality inkjet printer. Available displays: Full instructions
The display on the right shows MTF70 through MTF10 (spatial frequencies where MTF = 70 through 10% of the low frequency level). Spatial frequency is displayed in cycles per pixel, but Line Widths per Picture Height (LW/PH), cycles/inch, or cycles/mm can be selected with . |
MTF70 – MTF10: Polar coordinates, |
Wedge
Wedge measures the onset of aliasing (the spatial frequency where the bar count starts decreasing; related to vanishing resolution) as well as MTF (Modulation Transfer Function) from converging bar patterns, called “wedges”, which are a part of many popular resolution test charts, including eSFR ISO. “Hyperbolic” (linear in frequency) wedge patterns are central to the CIPA DC-003 standard for digital camera resolution measurement, which is included in the ISO 12233:2014 resolution measurement standard. Logarithmic wedges, supported in Imatest 2021.2+, have several advantages but they’re relatively new and not well known.
Wedge can analyze vertical and horizontal (but not diagonal) wedges. To the best of our knowledge, Imatest Wedge is the only software that can calculate MTF from wedge patterns, but there is a significant limitation with the calculation: the results at the Nyquist frequency (and also 2/3 Nyquist) are highly sensitive to the phase of the bars relative to the pixels, i.e., the sub-pixel positioning, which is difficult to control in practice.
|
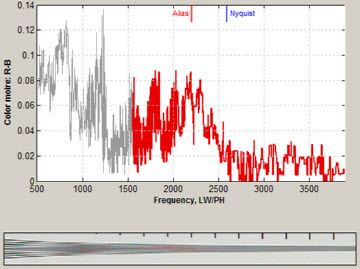
The display on the right shows Contrast (MTF) and the onset of aliasing (the frequency where the number of detected bars (smoothed) drops below the actual number of bars in the chart. The original wedges are shown (with squeezed aspect ratio). Several results including MTFnn for nn = 70-10 are shown below the image. The color moire plot for R-B (normalized Red − Blue channel) is shown on below.
Color moire |
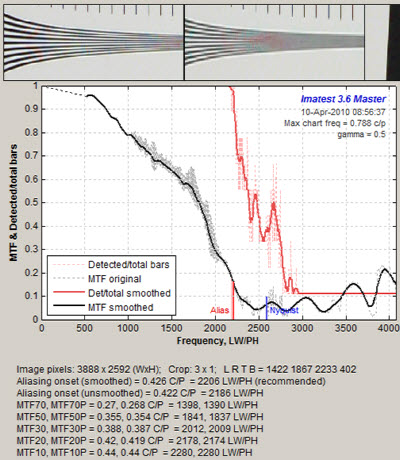
MTF and Aliasing onset (“vanishing resolution”) |
Random / Dead Leaves / Spilled Coins
Analyzes scale-invariant (or nearly scale-invariant) random patterns, which have a 1/f Fourier transform (1/f 2 Power Spectral Density (PSD)). Scale-invariant patterns have the same general appearance (the same statistics) regardless of distance. They include the Imatest “Spilled Coins” enhancement of the “Dead Leaves” pattern, recommended for texture measurements in the IEEE CPIQ Standard.
|
Since the random scale-invariant random pattern lacks contrasty edges, images typically have the minimum sharpening and maximum noise reduction for imaging systems with nonlinear/non-uniform signal processing (including most small consumer cameras and camera phones). This makes this pattern an excellent indicator of a camera’s ability to render fine low-contrast detail, i.e., texture. The Spilled Coins/Dead Leaves pattern has some low-contrast edges, making it fairly representative of realistic images— and also valuable for measuring texture response. Slanted-edges, by comparison, tend to have maximum sharpening and minimum noise reduction, and hence may not give an accurate indication of a camera’s response to fine texture. Noise power measured in the smooth outer regions, is subtracted from the PSD of the random pattern. Low contrast slanted-edges are used to verify the random pattern results. |
 MTF from Random scale-invariant pattern MTF from Random scale-invariant pattern |
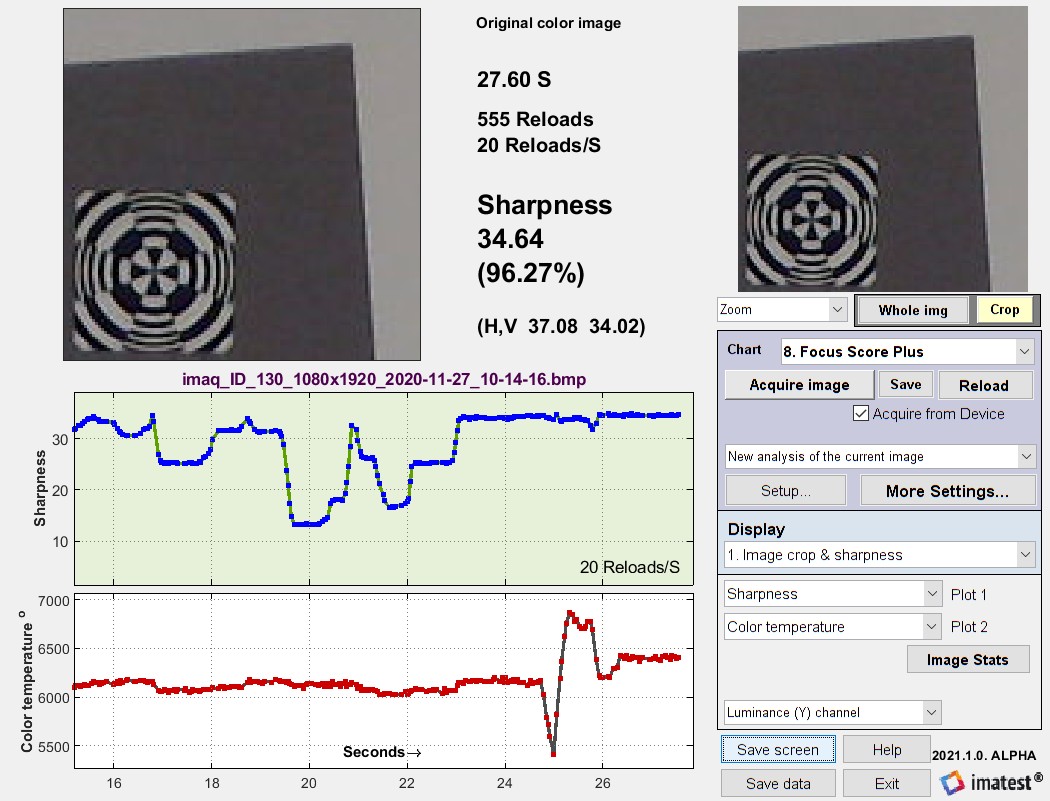
Focus Score Plus (formerly Any Image Sharpness)
Focus Score Plus measures sharpness of any scene. The sharpness metric is nonstandard and applies to the individual scene only (it cannot be used for comparisons with other scenes), i.e., it is a relative sharpness metric.
It is designed for optimizing focus during reloads of directly acquired images, for example, from live (video) feeds. Displays the image and a history showing changes in sharpness as the device is focused. A displayed percentage (%) number is the sharpness of the current frame as a percentage of the sharpest frame.
Focus Score Plus is new in 2021.1, and is an improvement of the Focus Score feature in earlier versions. Focus Score Plus calculates more than sharpness, and can be used for Auto White Balance/Auto Exposure/Autofocus (AWB/AE/AF) calculations. It can calculate focus for any object with well-defined edges.
It is extremely fast, and excellent for rapid focusing, but numerical results are not standard and cannot be used to compare different images, imaging systems, etc.
Focus Score (pre-Imatest 2021.1) displayed a history plot of sharpness-only. Focus Score Plus (Imatest 2021.1+) displays one or two history plots.
- Plot 1 can display Sharpness, Pixel levels normalized, Pixel levels original, Color temperature, or CIELAB c (√(a*2 + b*2) ).
- Plot 2 can display Pixel levels normalized, Pixel levels original, Color temperature, or CIELAB c (√(a*2 + b*2) ), or the time increment (mostly of interest to developers).
If you want to compare the sharpness of groups of files, you should run Find Sharp Files, which uses the same metric.
Algorithm: Focus Score and Find Sharpest Files use similar algorithms for ranking sharpness or measuring relative sharpness. The image is cropped then linearized. For iinearized pixel level P(x,y), the gradient ∇P(x,y) = i ∂P/∂x + j ∂P/∂y (2-dimensional derivative in the x and y-directions) is calculated at each point.
X-sharpness = sx = mean(|∂P/∂x|)/mean(P), where mean is taken over the crop. Similarly,
Y-sharpness = sy = mean(|∂P/∂y|)/mean(P)
Total sharpness = sTotal = sqrt(sx2 + sy2). This algorithm is extremely fast and works with any image as long as it has some detail.