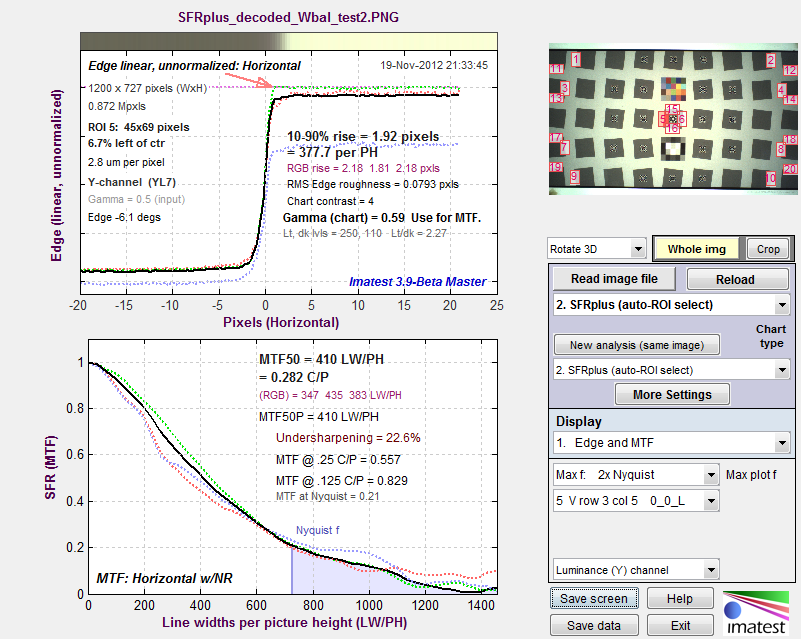
The following (Rescharts) SFRplus results shows the edge (unnormalized) and MTF results for one region near the center of the image that has the green channel saturated. (We deliberated boosted the image to saturate it.) The green channel is very clearly saturated, but luminance doesn’t quite reach saturation because of the low level of the blue channel. Note the sharp corner where the green channel reaches saturation. This corner has quite a lot of high frequency energy that is responsible for the high MTF of the green channel: MTF50 = 435 LW/PH, about 15-20% higher than the other channels.

SFRplus results showing how saturated green channel (red arrow illustrates onset) affects MTF
Measuring the impact of saturation is not easy because information is actually lost in the saturated region, i.e., you can’t tell exactly what you’d have gotten if the system were linear, and it’s difficult to make a reliable estimate of the corner sharpening caused by saturation, which is responsible for the MTF boost. So the metric we’ve chosen is
- the fraction of the average edge above 0.99 (99% of the maximum value) for the edge with the largest fraction, or
- the fraction of the average edge below 0.02 (2% of the maximum value) for the edge with the largest fraction.
These are about the best numbers I’ve been able to come up with to measure the severity of clipping, and I believe they are usable for pass/fail criteria. (the pass/fail threshold would be somewhere between 0.3 and 0.7).
Results
Here are results from the JSON output.
“sat_description”: “extreme edge max, edge min, fractions >.95, >.98, >.99, <.05, <.02″,
This is a description of the results in satsumall (saturation summary for all regions), below.
- The maximum value for all edges (20 in this analysis) for all colors (R, G, B, Y, where it can never be in the Y-channel because Y = 0.3*R + 0.59*G + 0.11*B.
- The minimum value for all edges.
- The largest fraction of pixels above the center value ((max+min)/2) for all edge regions and all colors where the pixel level is above 0.95 of the maximum pixel level (255 for 8-bit systems).
- The largest fraction of pixels above the center value where the pixel level is above 0.98 of the maximum.
- The largest fraction of pixels above the center value where the pixel level is above 0.99 of the maximum.
- The largest fraction of pixels below the center value where the pixel level is above 0.05 of the maximum.
- The largest fraction of pixels below the center value where the pixel level is above 0.02 of the maximum.
“satsumall”: [1,0.0636,0.978,0.967,0.967,0,0],
These are the actual results, showing no low saturation and strong high saturation (e.g., 0.978 (97.8%) of the pixels above the center value are above 0.95 (95%) of the maximum value.
“mean_pixel_level_ctr_9th”: [0.7530514761],
This is the mean relative pixel level (fraction of the maximum level) for the central ninth (by area; 1/3 X 1/3 length) of the image. It is used in the SFR Setup window to indicate underexposure (when < 0.3) or overexposure (when > 0.8). These numbers would not necessarily be used for pass/fail.
Pass/fail results
To obtain pass/fail results for quadrants and saturation, the lines shown in boldface below (all optional) should be added to the pass/fail ini file. Comments shown in red are not a part of the file.
[sfrplus]
…
Chart_mean_pixel_level_bounds = .3 .8|
The lower and upper bounds of the chart mean normalized pixel level (for the central 1/9 = 1/3 X 1/3 linearly) of the chart.
Low_pixel_saturation_fraction_max = .3
High_pixel_saturation_fraction_max = .3
Chart_radial_pixel_shift_max = 15
Here is the corresponding JSON pass/fail result, with many lines omitted.
“passfail”: {
…
“High_pixel_saturation_fraction_max”: [0.3],
“High_pixel_saturation_fraction”: [0.967032967],
“High_pixel_saturation_fraction_passed”: [0],
“Low_pixel_saturation_fraction_max”: [0.3],
“Low_pixel_saturation_fraction”: [0],
“Low_pixel_saturation_fraction_passed”: [1],
“Chart_mean_pixel_level_bounds”: [0.3,0.8],
“Chart_mean_pixel_level”: [0.7530514761],
“Chart_mean_pixel_level_passed”: [1],
…
}

