In this post, we will be using the Contrast Resolution Chart and Imatest Master to measure the dynamic range of a Google Pixel 2 XL. The dynamic range of a camera is the reproducible tonal range in an imaging system. Put simply, it is the range between the darkest black and the brightest white of an image and is typically measured in decibels (dB). It is an important image quality factor in many applications from machine vision to mobile cameras and more recently, automotive camera systems. In this use case, we will be evaluating both the HDR+ (default) and HDR off modes of the Pixel 2 XL; however the procedure can be used to test any camera system’s dynamic range. You can read more details about Imatest’s dynamic range test solutions
Outline
Intro | Setup | Capture Procedure | Analysis | Results | Conclusion
Google Pixel 2 XL
Setup
Testing a camera’s dynamic range can be difficult and requires careful setup. In this section, we will review all of the relevant components of performing a sufficient dynamic range test.
Chart
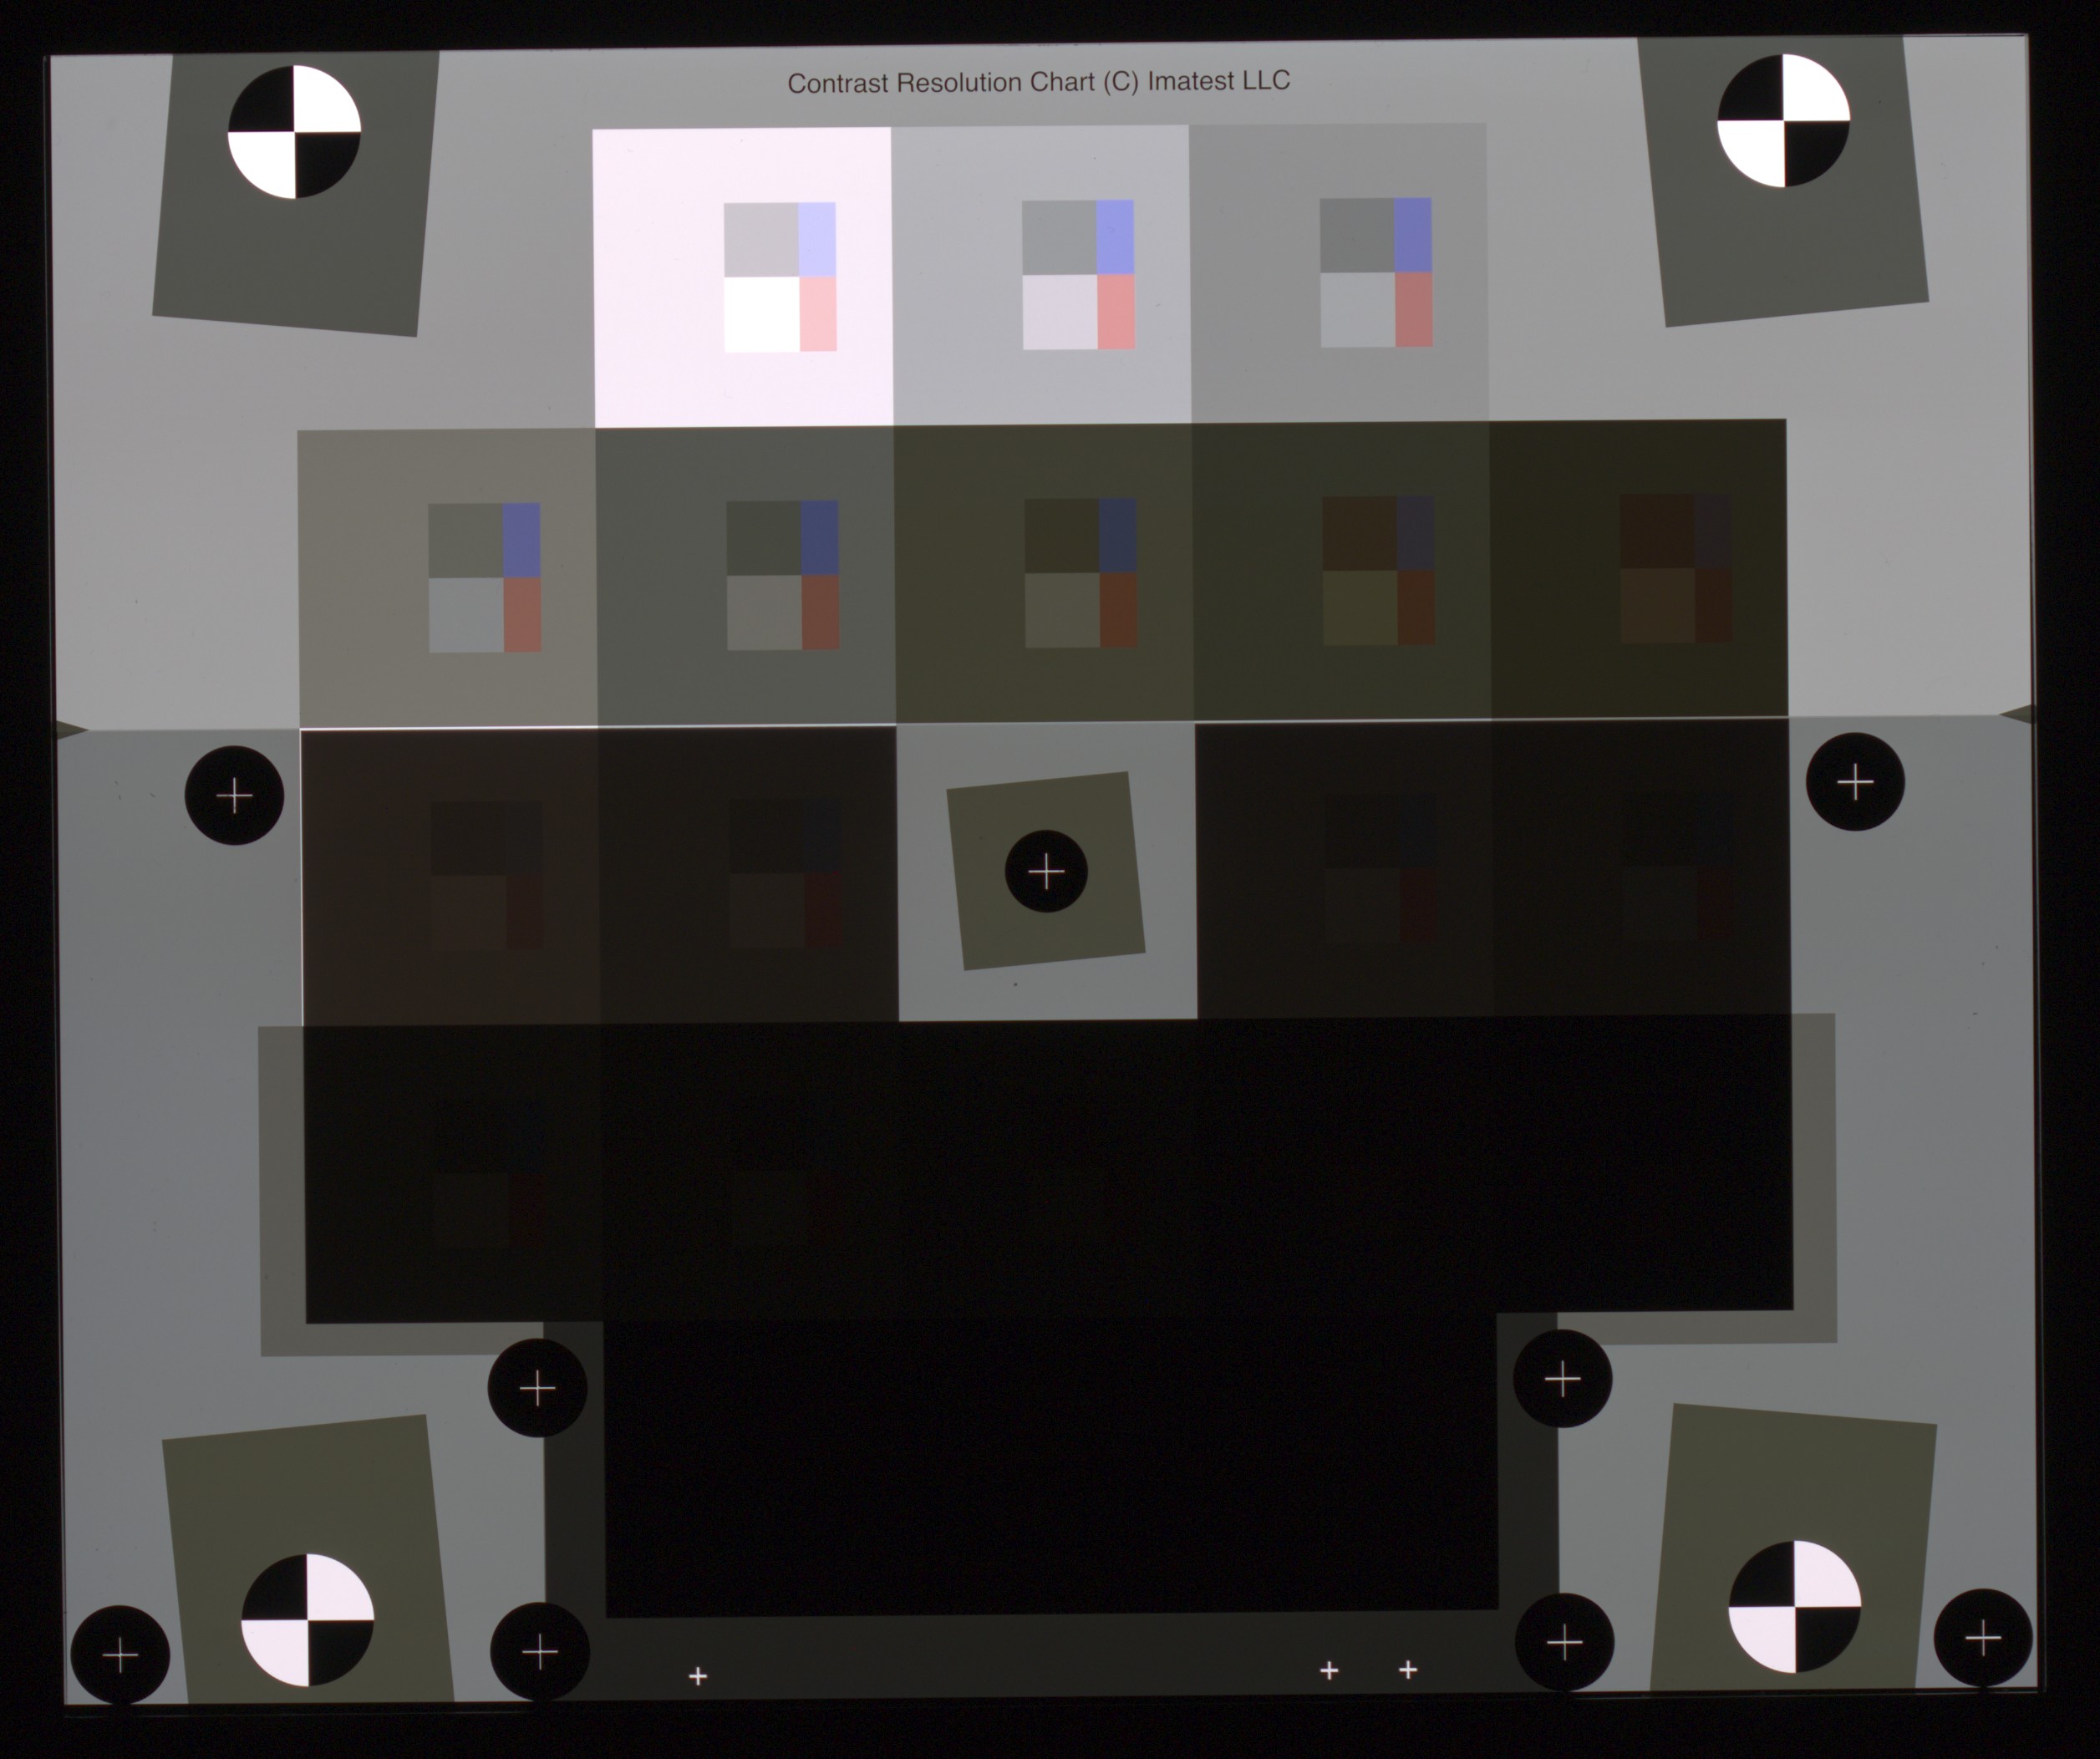
Contrast Resolution Chart
One of the major components to testing dynamic range and the first consideration is the chart. There are a variety of dynamic range test charts available but the one we will be using for this test is the Contrast Resolution chart. There are several unique features to this chart that make it ideal for testing a system like the Pixel 2 XL. The first is the radial arrangement of the patches. This is important because it helps control for lens fall off. Second is the dynamic range of the target itself. The chart must have a higher dynamic range than the system or else you end up measuring the chart and not the camera. The Contrast Resolution chart has a dynamic range of ~95 dB which is sufficient for almost all systems with a lens. The third and most important reason for choosing this chart is the Contrast resolution dynamic range calculation. The inner light and dark gray patches on this target allow for a more robust calculation of the dynamic range of tone mapped images; which can adversely affect the quality of other dynamic range calculations.
Lighting
![]()
ITI Lightbox with Contrast Resolution Chart
The next component to consider is the light source. For our test, we will be using the 10,000 lux ITI Lightbox 5100K. This lightbox is a good choice for our purposes because of its uniformity (>95%). The analysis of the chart assumes a constant amount of light being transmitted across and through the chart. The contrast resolution dynamic range calculation works because the chart has known density steps between the patches. If the light source has low uniformity than the assumption is not true and the results can be impacted.
Environment
![]() Test setup
Test setup
The third consideration is the environment you will test in. It is important to test dynamic range in a sufficiently dark environment limiting the amount of stray light that might enter the camera system as much as possible. The extra light entering the system can increase the amount of flare light (sometimes called veiling glare). Flare is the stray light that fogs images and is caused by reflections between surfaces of lens components and the inside barrel of the lens. Stray light can cause reduced contrast in dark parts of the image which in turn can make for erroneous dynamic range measurements. See our recent study: “Measuring the impact of flare light on dynamic range” for more information. Our testing environment will have only one controlled light source to illuminate the chart and no other sources of light (e.g., overhead lighting, LEDs on electronics, etc.).
A common source of erroneous measurements due to the testing environment are reflections on the chart itself. Because the darkest patches of the target let through such little light, it is easy for a non-negligible amount of stray light to be reflected off the front side of the chart. This extra light will make it seem as though more light is present in the patch area than is actually being transmitted through the chart and will adversely influence the analysis. To mitigate the reflections, we use a custom shroud to block surfaces that can reflect light from the lightbox. Unfortunately, the camera itself is the most likely culprit for unwanted light due to the potential for light to bounce off of it. The Pixel 2 XL in our case, is no exception. The particular model we are using has a white back which reflects lots of light back at the chart’s front surface. Since we are aware of this, we have taken extra care to shield all of the phone except for the lens from the light to stop any unwanted light from bouncing back at the chart.
![]() Example of a development board reflection off the front of the chart
Example of a development board reflection off the front of the chart
More on the shroud
Depending on the system, and the environment of the test, a shroud may not be necessary. However, it provides a consistent lighting environment for every test and should be considered for benchmarking and comparing different systems. For more information on reflections and shroud materials, see this post. For information on custom testing environments, please contact sales@imatest.com .
Capture Procedure
![]()
Contrast Resolution chart viewed through the native camera app
Ten images were captured with the Pixel 2 XL with the above setup. The phone was set to HDR+ mode. For each image, the exposure was adjusted on the device by tapping the area on the screen where the upper gray background of the chart was present (directly to the left of the second row). We did this to ensure similar exposure in all of the images. The acrylic shroud with matte black interior was placed around the lightbox with the phone placed as close as possible to the opening on the shroud. For this test, the lightbox was set to the 5100K color temperature setting and minimum brightness (~30 lux). We chose these settings because they are representative of a realistic low-light environment in which the camera phone may be used. Please note, the light settings could vary greatly depending on the application. Once enough images were taken, we inputted them into our software, Imatest Master, for proper analysis.
Analysis
The following analysis of these images was done in Imatest Master 5.0.
Each image was analyzed in the Multitest module. Opening the Multitest Setup, we made sure to check that “3. Contrast Resolution” was selected for the chart type.
The plot we were most interested in was the Noise/SNR plot. Under this section in the setup dialog, we selected “3. SNR dB vs. Inp Density (RGBY)” and “3. Exposure in DB (-20*target density) DR in dB” from the drop downs. We also checked “Image plot” so we could visualize the results on the images themselves. See here for more information analyzing the Contrast Resolution chart.
The data was saved in JSON format and the relevant metrics were then parsed and averaged. The data we are interested was saved in the field “Contrast_Resolution_Dyn_Rng_dB”. The field contains 4 values, the Contrast Resolution dynamic range in decibels at SNR = 0, 6, 12, 20.
Results
The plot below shows the Contrast Resolution Dynamic Range for the two modes averaged over ten captures. The standard error is included. We aggregated this data from several runs of the Multitest module in Imatest Master. As you can see in the plot below, there was a significant increase in dynamic range when using HDR+ mode versus HDR off.
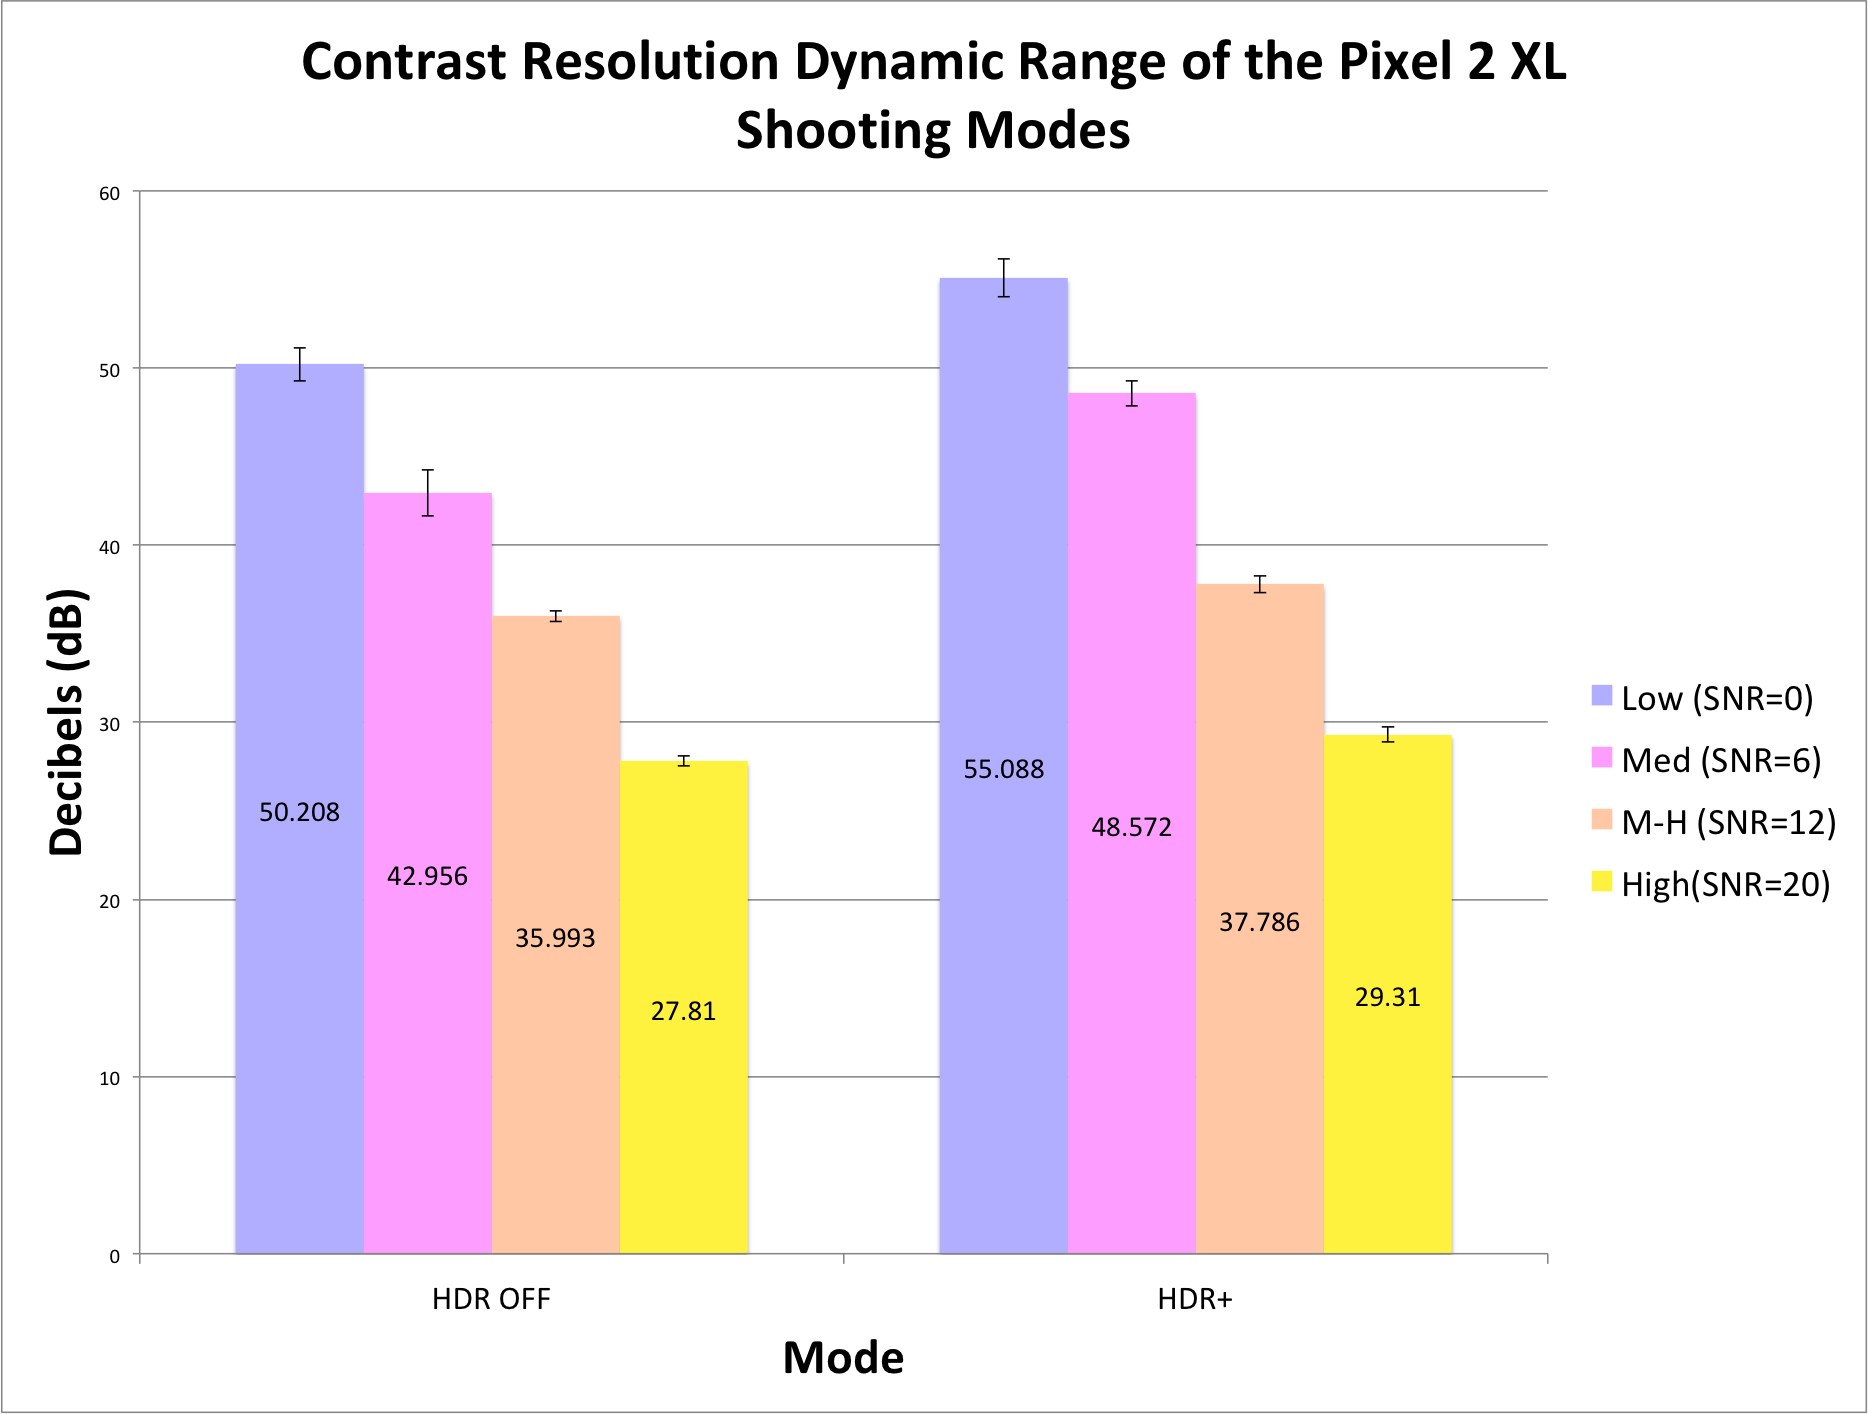 Chart comparison of the HDR-off vs. HDR+ results
NOTE: If you are using Imatest software, this information can be viewed for individual images using the Noise Plot in the Multicharts module.
Since we checked “Image Plot”, we can also visualize the results on the image of the Contract Resolution chart. The two plots below show an exaggerated image plot so that the noise in each patch can be visually examined.
![]() HDR Off Image Plot (Constant xyY)
HDR Off Image Plot (Constant xyY)
![]() HDR+ Image Plot (Constant xyY)
HDR+ Image Plot (Constant xyY)
A notable difference in the plots can be seen in patch 11 (isolated images below). We can see that in the HDR+ plot (right), the details of the inner gray patches are still visible where they are not in the HDR off plot (left).
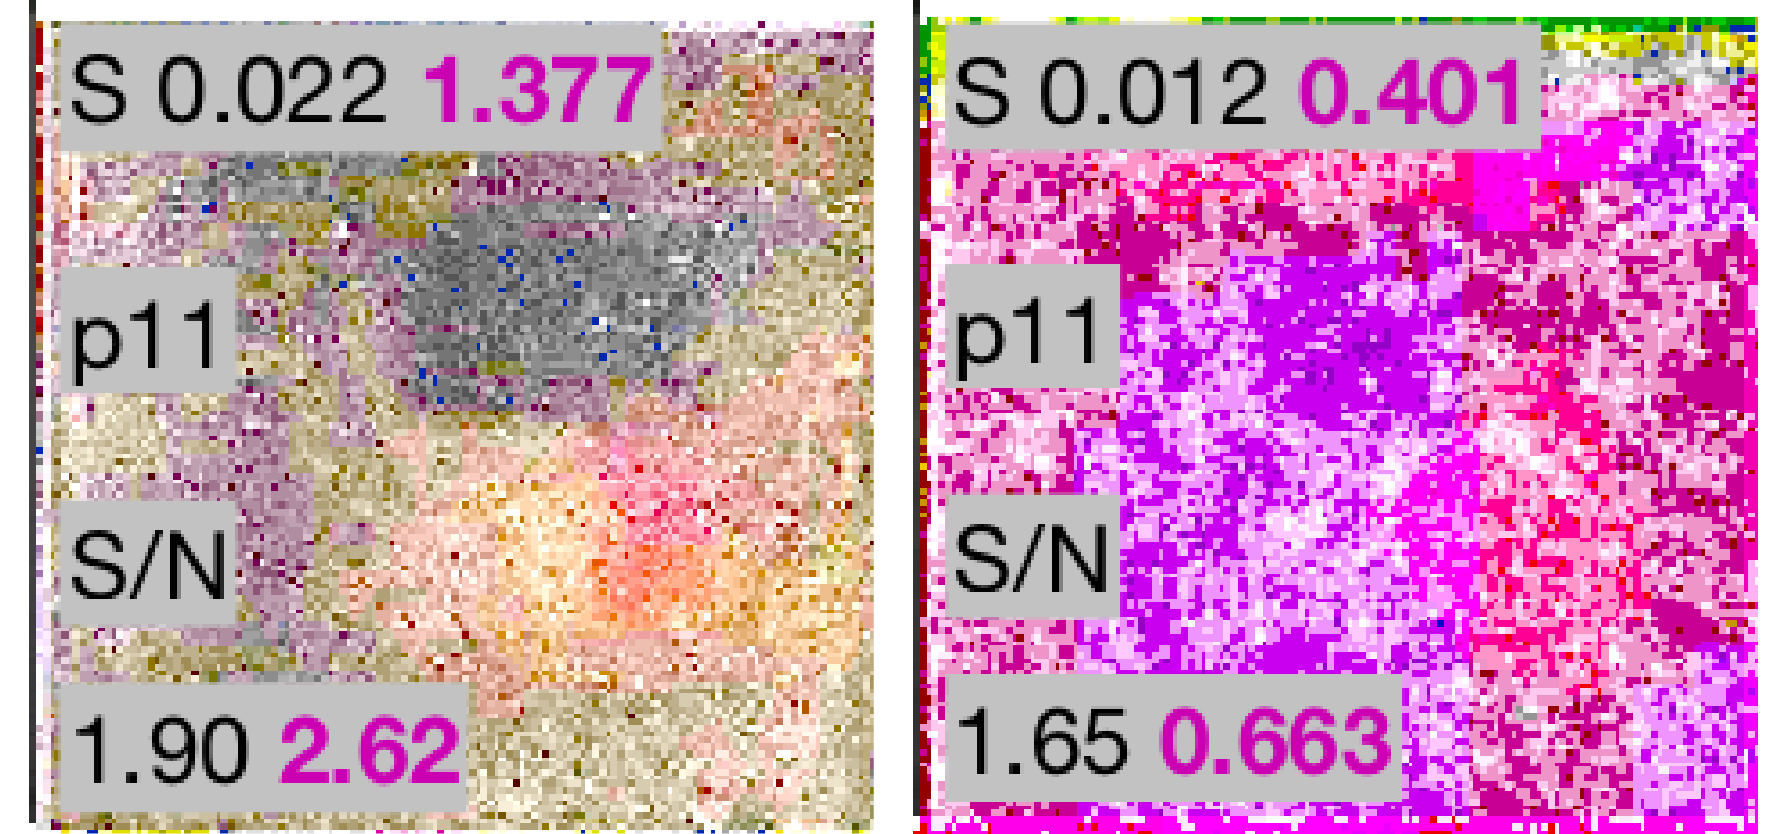 Patch 11 visual comparison (Left: HDR Off, Right: HDR+)
Conclusion
By following this procedure, using the Contrast Resolution chart and Imatest Master, we were able to analyze the dynamic range of our camera effectively. As we can see in the above diagrams, the summary plot results indicate that the HDR+ mode increased the dynamic range in the images by 5 dB on average. We are also able to visually see the increased range by looking at patches in the Image Plots view.
Ideally, we want to tailor our test setup as much as possible to the application being tested. In this particular case, the subject of our testing is the different HDR processing of the Pixel 2 XL. We have limited information on the specific algorithms being used when HDR is turned off versus HDR+ and their impact on image quality under different lighting situations and with different target subjects, so we are limited in the conclusions we can draw. Thus, the results reported above do not represent all use cases. A more exhaustive study would need to be done to produce results that would reflect the broad range of possible use cases.
For more information, or to learn more about how to properly set up your testing environment, talk to a solution expert.