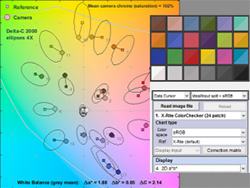
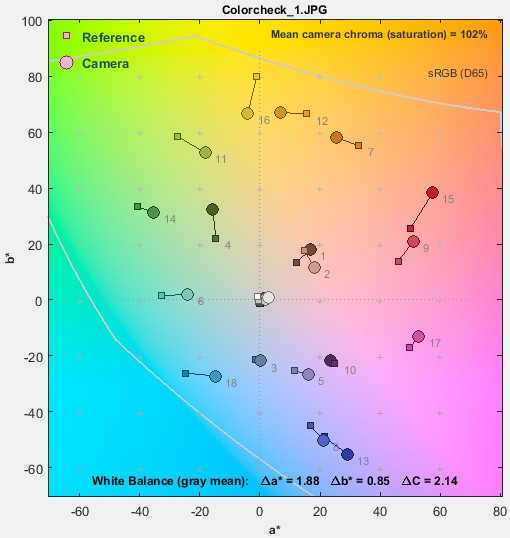
Imatest has several two-dimensional displays for comparing test chart reference (ideal) colors with measured (camera) colors, where reference colors are represented by squares and measured values are represented by circles. The two most familiar representations— CIELAB a*b* and CIE 1931 xy chromaticity — are shown below. They are for the Colorchecker image, also shown below, where the upper-left of each patch is the reference color and the lower-right is the camera color.
 |
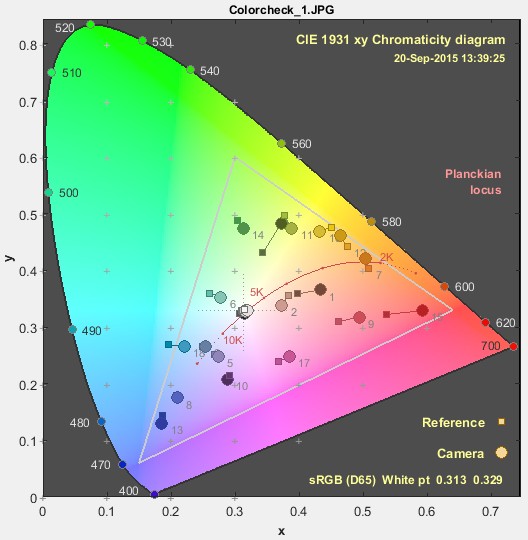 |
| How different are the reference and camera colors in the Colorchecker image on the right, represented in these diagrams? | 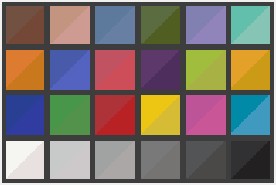 |
Color differences and MacAdam ellipses
When these representations are viewed, the question naturally arises, “how different are the reference and camera colors?” Color differences can be quantified by several measurements— ΔEab, ΔE94, and ΔE00 (where 00 is short for 2000), where ΔE measurements include chroma (color) and luminance (brightness). If brightness (L*) is omitted, these measurements are called ΔCab, ΔC94, and ΔC00, where C stands for chroma (which includes a color’s hue and saturation). In this post we will discuss chroma differences. ΔCab = (a*2+b*2)1/2 (sometimes called ΔC) is the simple Euclidean (geometric) distance on the a*b* plane. It’s familiar but not accurate.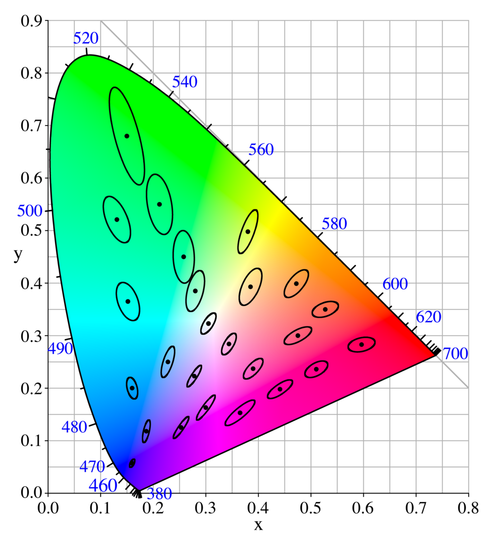
Starting with Imatest 4.2, Imatest’s two-dimensional chroma displays— CIELAB a*b*, CIE 1931 xy chromaticity, CIE u’v’ chromaticity, Vectorscope, and CbCr— can display ellipses that assist in visualizing perceptual color differences.
These ellipses were developed from the MacAdam ellipses, shown on the right.
MacAdam ellipses shown in the
CIE 1931chromaticity diagram,
magnified 10X (from Wikipedia)
The MacAdam ellipses were developed from a set of experiments performed at the University of Rochester in 1942, in which an observer tried to match pairs of colors, one fixed and one variable. The ellipse parameters are based on statistical variations in the matching, which are closely related to Just Noticeable Differences (JND). Twenty-five colors (whose xy values are shown as • in the illustration) were used.
Almost all images of MacAdam ellipses show the ellipses for the original 25 colors. In imatest we use a sophisticated interpolation routine to determine the ellipse parameters for color test charts. This is quite reliable since the gamut of the original color set extends well beyond the gamut of the widely-used sRGB color space (the standard of Windows and the internet), as well as most other color spaces used in imaging. At least 10 of the original colors are outside the sRGB gamut. sRGB is used for all examples in this post.
The ellipses are a visual indicator of the magnitude of perceived color (chroma) difference. The longer the ellipse axis, the greater the distance on the a*b* plane for a given color difference.
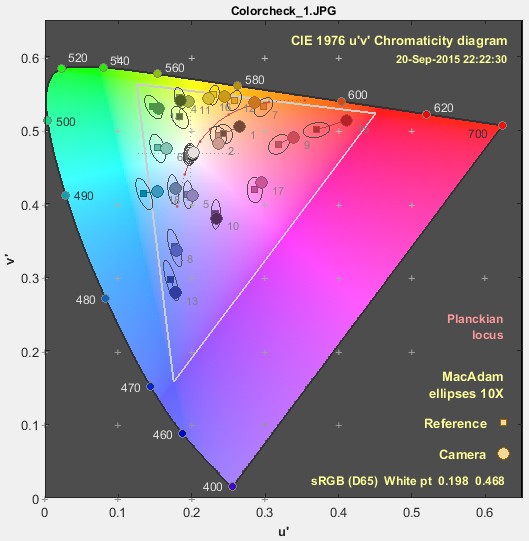
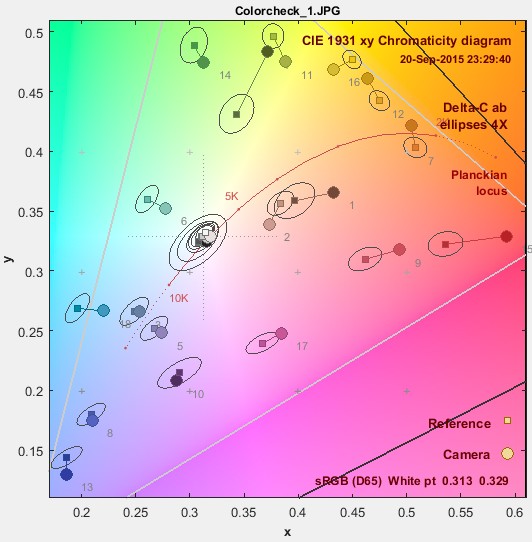
Here are the MacAdam ellipses for the X-Rite Colorchecker, in xy (from xyY) and u’v’ (from Lu’v’) representations, displayed in Multicharts. u’v’ is supposed to be more perceptually uniform than xy, and that is not evident inside the sRGB gamut. This may be one reason why u’v’ hasn’t gained much traction in the imaging industry.
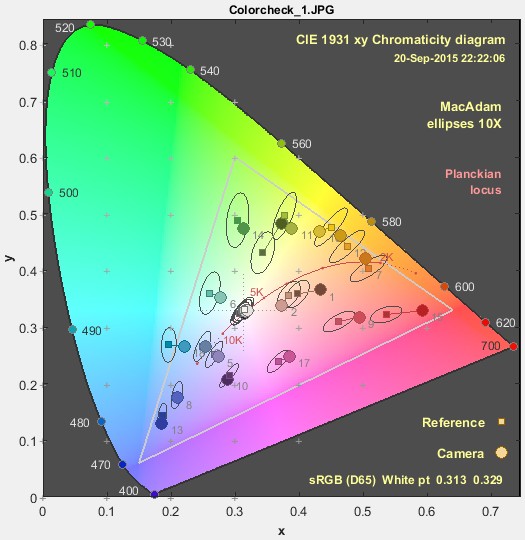 xy Colorchecker MacAdam ellipses, magnified 10X |
 xy Colorchecker MacAdam ellipses, magnified 10X |
The MacAdam ellipses are not widely used in imaging (though they seem to have traction in LED lighting). Instead, color differences based on CIELAB (L*a*b*) color space, which was developed in 1976 with the intent of being much more perceptually uniform than xyY, are used. Color differences are usually presented as ΔEab, ΔE94, or ΔE00. In all ΔE (color difference) equations, the Luminance (L*) term can be easily removed, leaving chroma differences ΔC, which can be displayed in in two dimensions.
Color difference ellipses in Imatest
All Imatest modules that can produce two-dimensional color different plots can display color difference ellipses. Colorcheck, SFRplus, and eSFR ISO display them in the a*b* plot. Multicharts and Multitest display them in a*b*, xy, u’v’, Vectorscope, and CbCr plots. In addition to MacAdam ellipses, which are not generally used for color difference measurements (but are interesting for comparison), the following color difference metrics are presented. The illustrations below are for a Colorchecker (shown above) analyzed in Multicharts.
ΔCab (plain ΔC – 1976)
ΔCab is simple geometric distance in the a*b* plane of CIELAB (L*a*b*) color space. When CIELAB was designed, the intent was that ΔC = 1 would correspond to one Just Noticeable Difference (JND). This may hold for colors with very low chroma (a*2+b*2)1/2, but it fails badly as chroma increases, which is why ΔE94 and ΔE00 were developed. ΔEab and ΔCab are familiar and often mentioned in imaging literature, but they should never be used for important measurements.
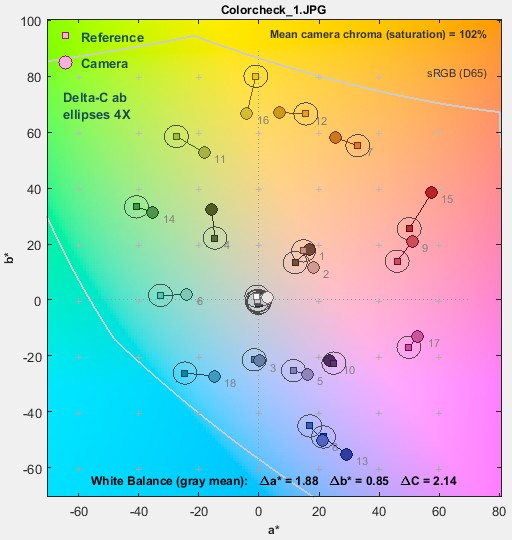 a*b* Colorchecker ΔCab ellipses (circles!), magnified 4X |
 xy Colorchecker ΔCab ellipses, magnified 4X, zoomed in |
ΔC ellipses are always show magnified 4X (10X would be too large for clear display). We show the xy plot zoomed in so more detail is visible.
ΔC94 (ΔC 1994)
ΔE94 was developed to compensate for the deficiencies of ΔEab. Circles become ellipses with their major axes aligned with the radius from the origin (a* = b* = 0). It is more more accurate than ΔEab, especially for strongly chromatic colors.
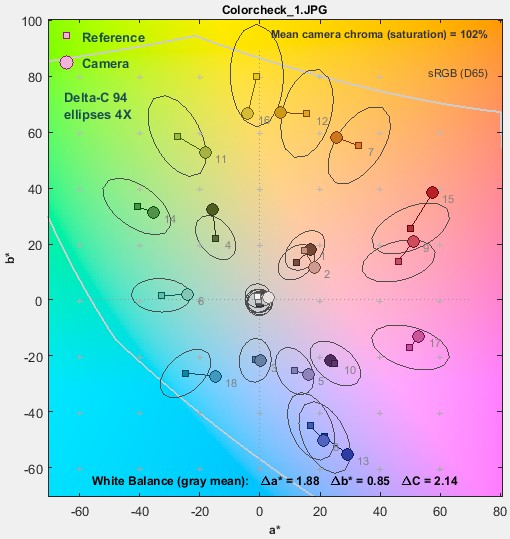 a*b* Colorchecker ΔC94 ellipses, a*b* Colorchecker ΔC94 ellipses,magnified 4X |
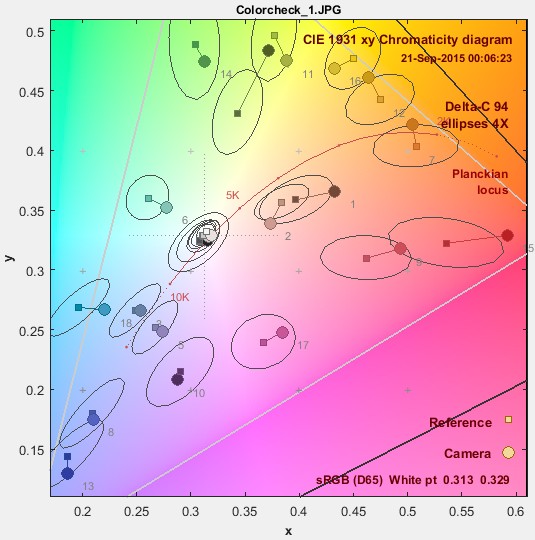 xy Colorchecker ΔC94 ellipses, magnified 4X, zoomed in |
ΔC00 (ΔC 2000)
ΔE00 was developed as a further refinement over ΔE94. It has an extremely complex equation. Though not perfect, it’s the best of the current color difference formulas, and is recommend when color differences need to be quantified. It’s quite close to ΔE94, except for some blue colors. Until we added these ellipses to Imatest, there was no convenient way to visually compare the different ΔE measurements!
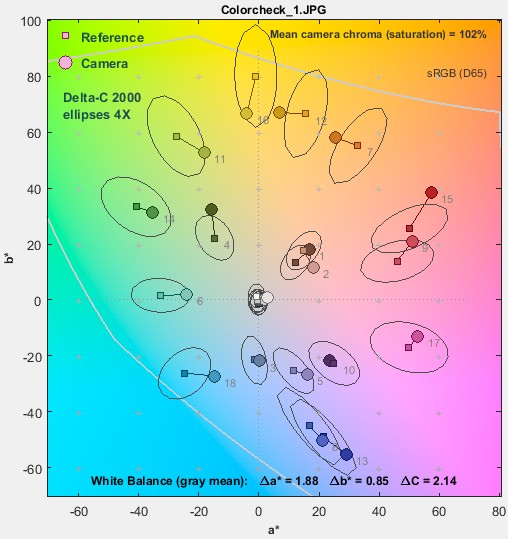 a*b* Colorchecker ΔC00 ellipses, a*b* Colorchecker ΔC00 ellipses,magnified 4X |
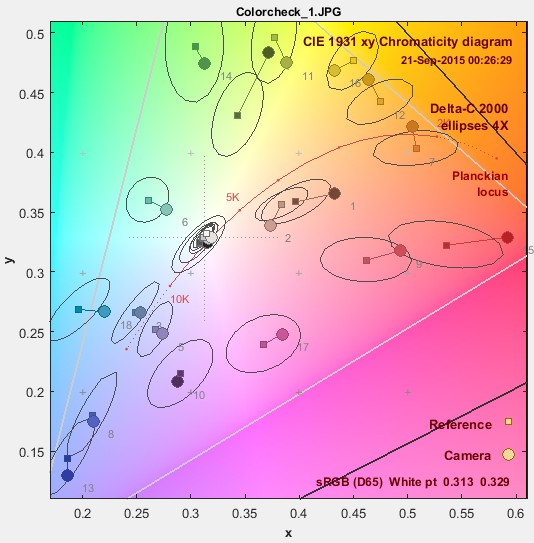 xy Colorchecker ΔC00 ellipses, xy Colorchecker ΔC00 ellipses,magnified 4X, zoomed in |
Displaying the ellipses in Imatest
In Imatest 4.2 the ellipses are not displayed by default. We may change this in a later version. The table below shows how to control ellipse display.
| Multicharts Multitest |
Multicharts and Multitest share ini file settings. Ellipse settings for both are set in the Color ellipses dropdown menu in Multicharts. Standard ellipse magnification (10x for MacAdam ellipses, 4X for Delta-C ellipses) is recommended. |
 |
| Colorcheck | The selection is in the middle-left of the Colorcheck settings window. |  |
| SFRplus eSFR ISO |
In (Rescharts) SFRplus and eSFR ISO, ellipse settings are located in the Ellipses dropdown menu, displayed to the right of the bottom of the a*b* plot, when it is selected. |  |