Measuring MTF is not a typical application for Stepchart— certainly not its primary function— but it can be useful with multiburst patterns, which are a legacy from analog imaging that occasionally appear in the digital world. The multiburst pattern is not one of Imatest’s preferred methods for measuring MTF: see the MTF Measurement Matrix for a concise list. But sometimes customers need to analyze them. This feature is available starting with Imatest 4.1.3 (March 2015).
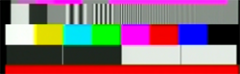
Here is a crop of a multiburst pattern, generated by a Tektronix device:
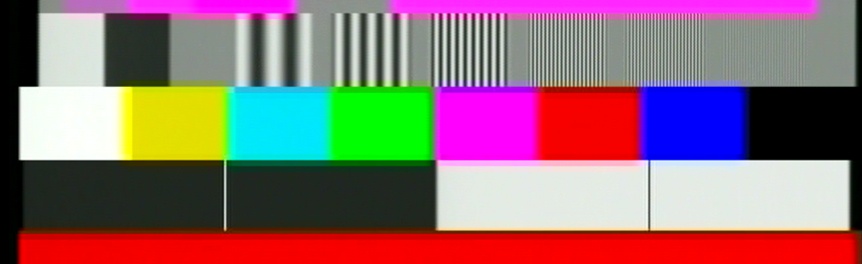
Crop of Multiburst pattern: click on image for full-size pattern that you can download.
Running Stepchart with the multiburst pattern
Open Stepchart, then read the multiburst image. Make a rough region selection for the multiburst pattern— it will be refined as shown below. Then press Yes (not Express mode) to bring up the Stepchart settings window.
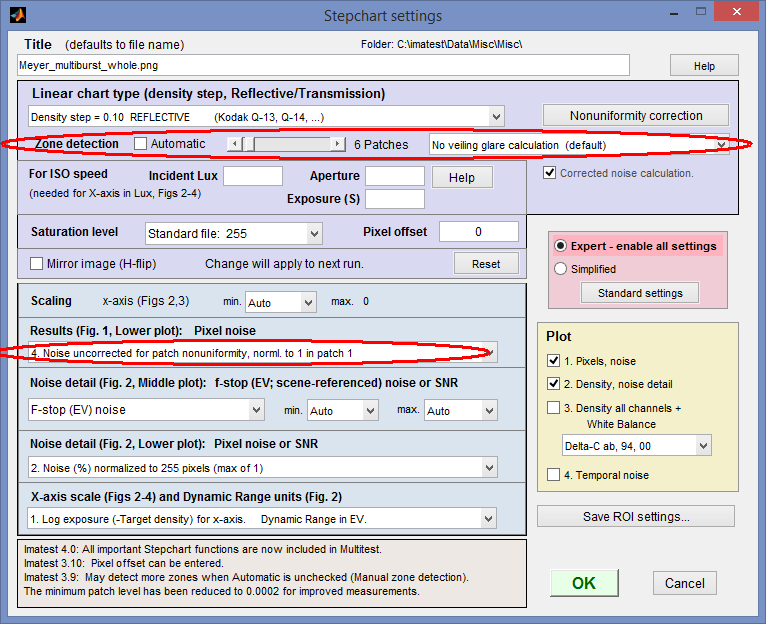 Stepchart settings for Multiburst MTF measurement
The key settings are circled in red. Automatic (Zone detection) should be unchecked and 6 patches should be selected using the slider (for this pattern; some multiburst patterns have as few as 5 zones). Under Results (Fig. 1, Lower plot), select 4. Noise uncorrected for patch nonuniformity, norml. to 1 in patch 1. Only Plot 1. Pixels, noise is relevant to the multiburst image. When settings are complete, click OK. If this is the first run for this size of image, the fine ROI adjustment window will appear.
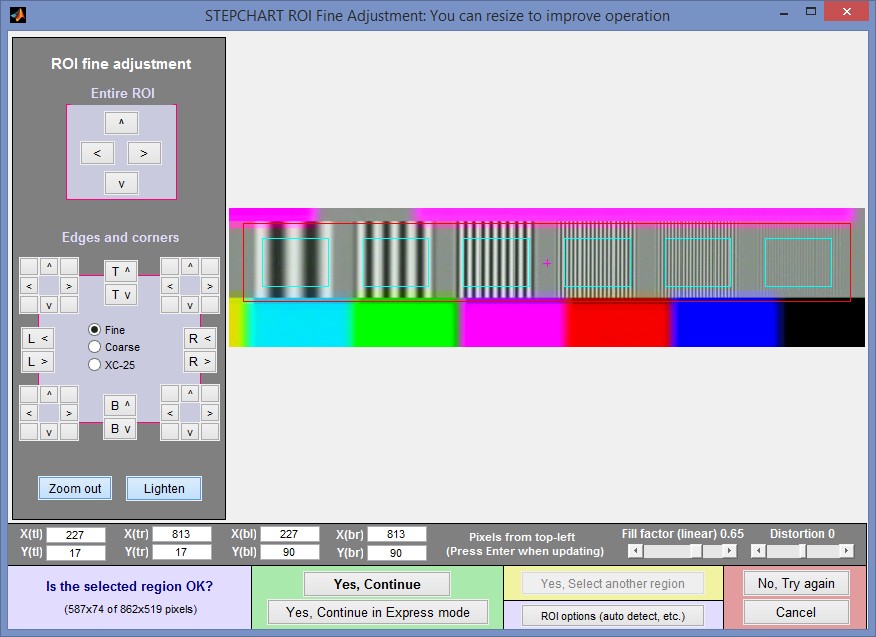 Fine ROI adjustment window for Multiburst pattern in Stepchart. May be enlarged.
Results
The standard deviation of the pixels in the patch, which is normally used to measure noise, is proportional to the MTF of the pattern in the patch (as long as it’s above the noise). To obtain an accurate result the patch nonuniformity correction is turned off (by setting Results (Fig. 1, Lower plot) to 4. Noise uncorrected…, as indicated above.
The key results are in the first Stepchart figure, most importantly in the lower plot, which contains the MTF for the patches.
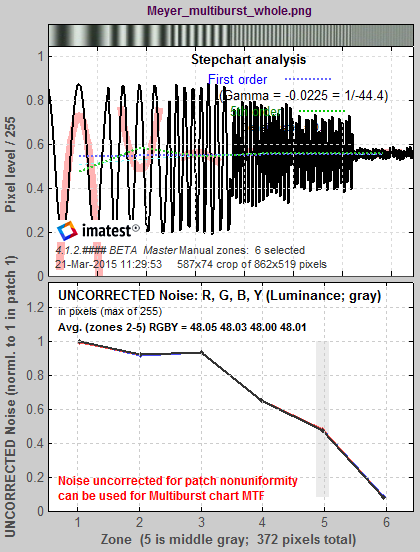 Stepchart Multiburst results: MTF is in lower plot
|
There are several ways we could enhance this calculation, but we will only do them if their is sufficient interest.
|