Testing a 1-5x Macro Canon MP‑E 65mm Lens
Imatest’s Checkerboard module is our new flagship module for automated analysis of sharpness, distortion and chromatic aberration from a checkerboard (AKA chessboard) pattern. The big benefit of using the checkerboard is that there are looser framing requirements than with other kinds of test targets. While checkerboard lacks the color and tone analysis provided by SFRplus and eSFR ISO, these features are not available on the high precision chrome on glass substrate, so the checkerboard is the optimal pattern for this test.
The Imatest Micro Multi-Slide contains high precision checkerboard patterns with many different scales of frequencies. This makes a single target capable of effectively testing a wide range of magnifications.
We obtained the below cycles per object mm by dividing the LW/PH obtained from the image by 2*image height in mm.
| Magnification | Image height | Center MTF50 | Best Aperture |
| 1x | 23.71 mm | 29.61 cycles / object mm | f/5.6 |
| 2x | 11.86 mm | 57.04 cycles / object mm | f/5.6 |
| 3x | 7.90 mm | 74.55 cycles / object mm | f/5.6 |
| 4x | 6.07 mm | 81.52 cycles / object mm | f/4 |
| 5x | 4.74 mm | 87.61 cycles / object mm | f/4 |
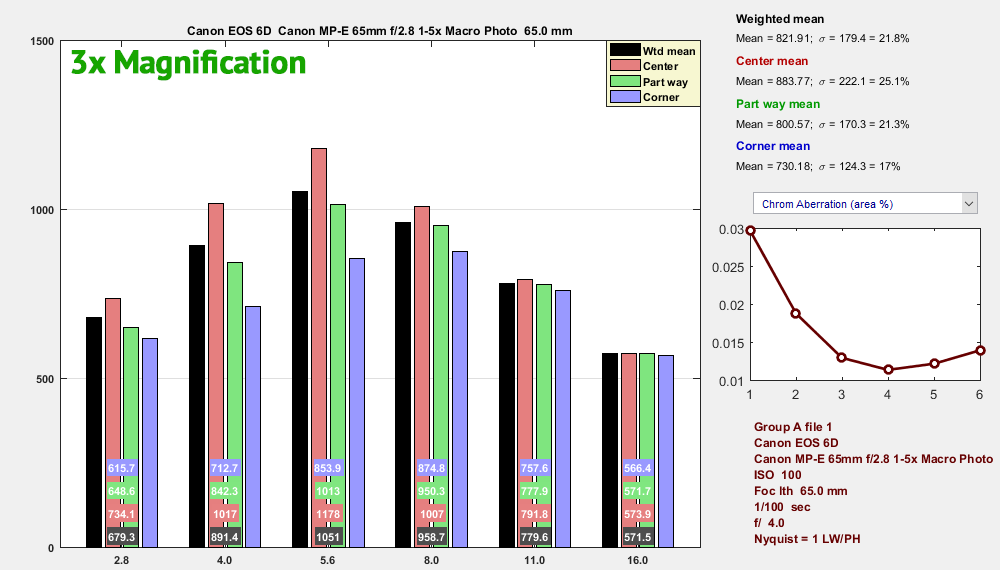
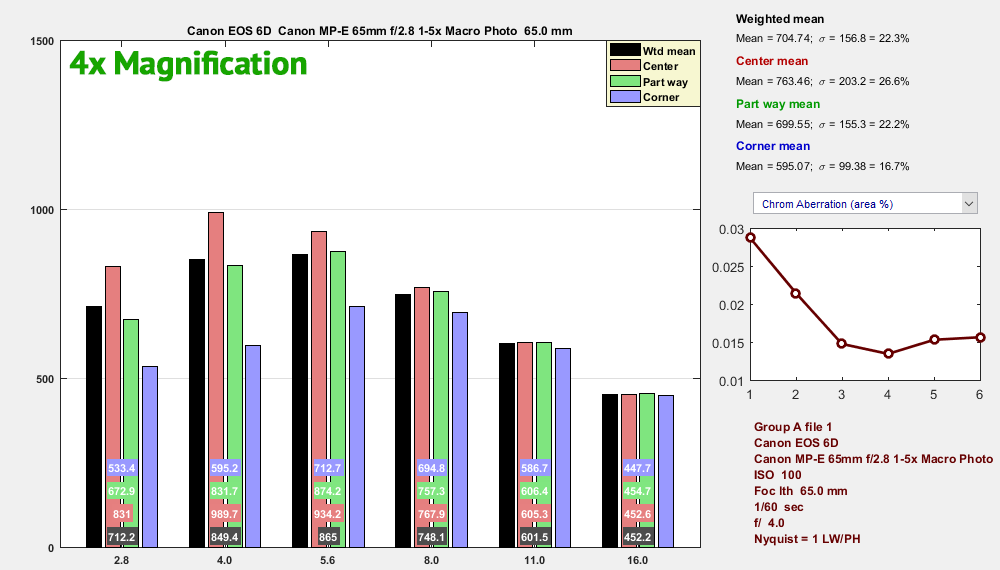
Thanks to this study, we now know to select the f/4 aperture at 5x magnification to maximize the resolving power of this lens. Detailed results, capture and analysis procedures are available below.
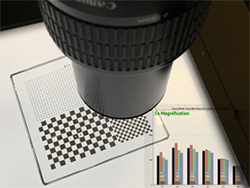
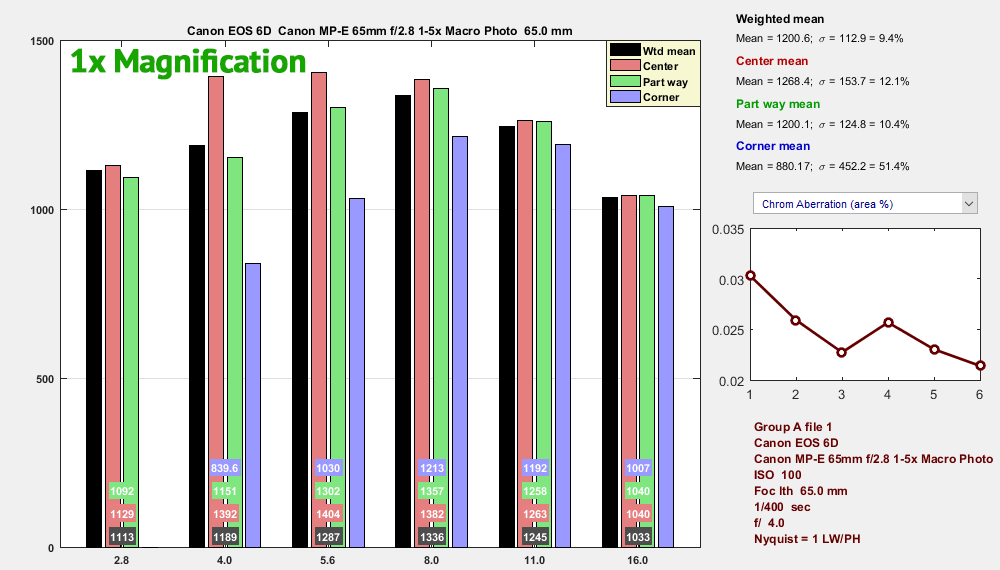
1x Magnification
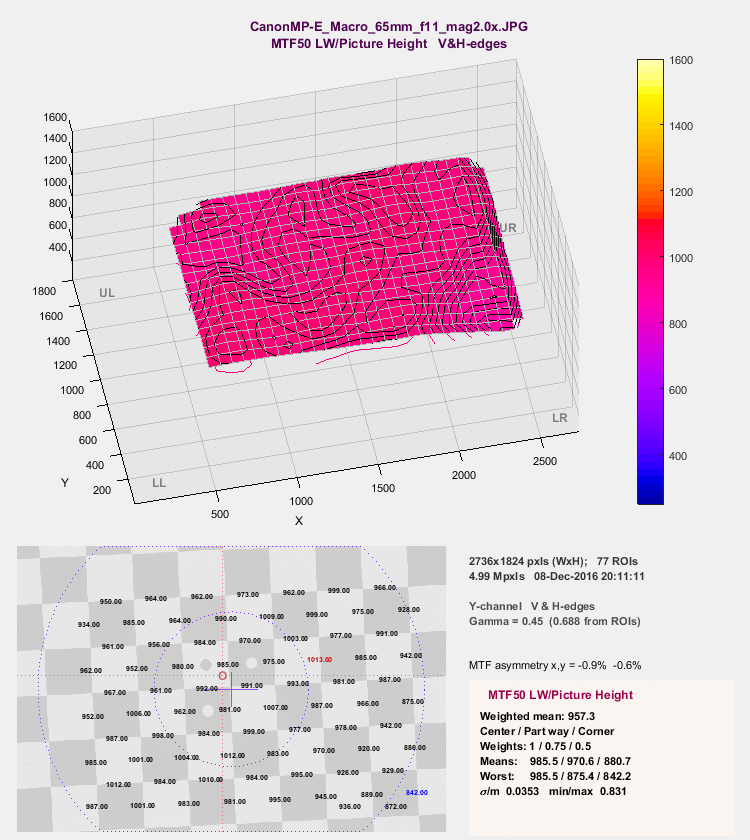
This report is shown in line widths per picture height (LW/PH):
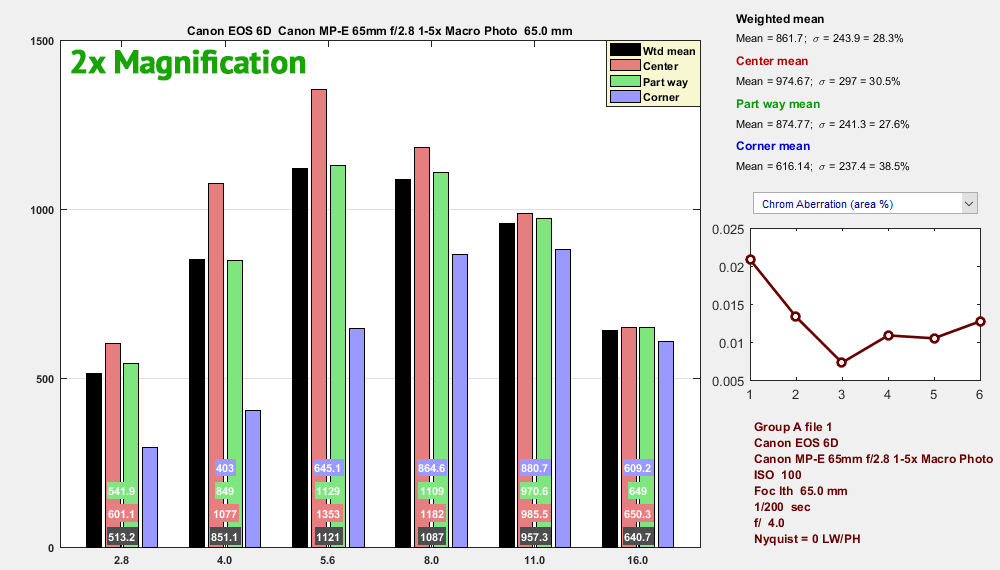
2x Magnification
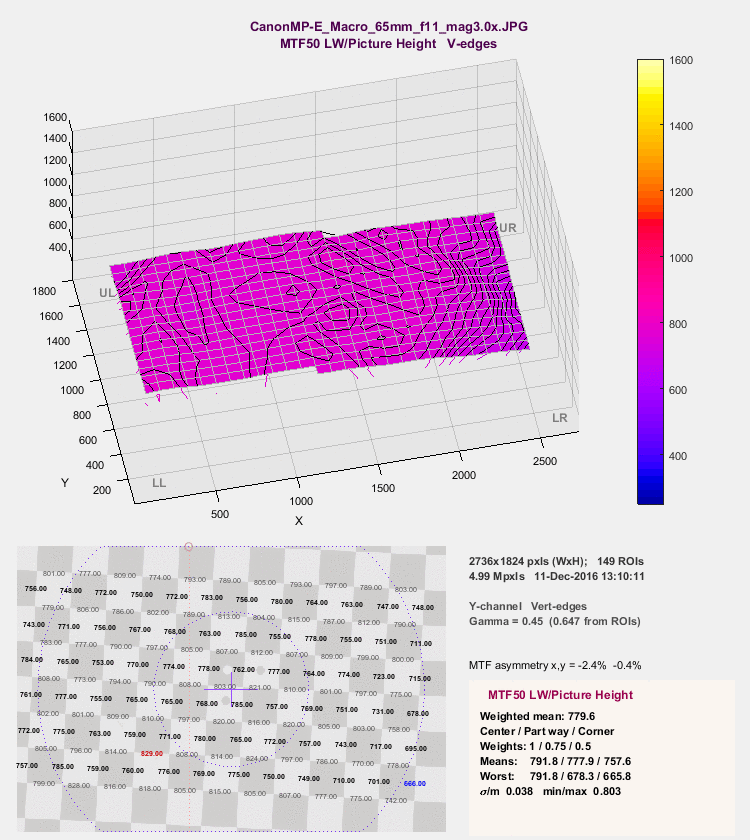
3x Magnification
4x Magnification
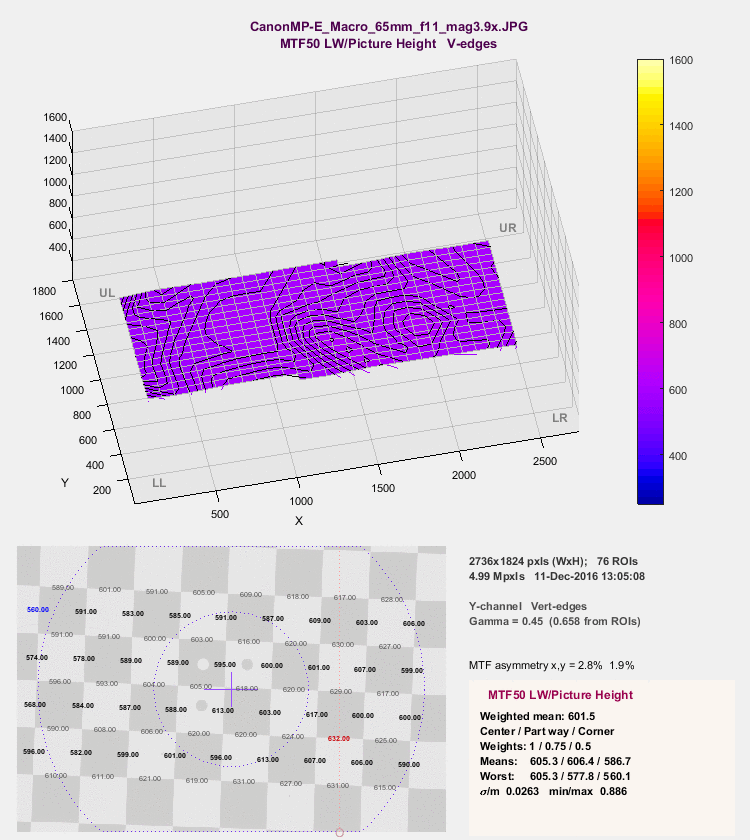
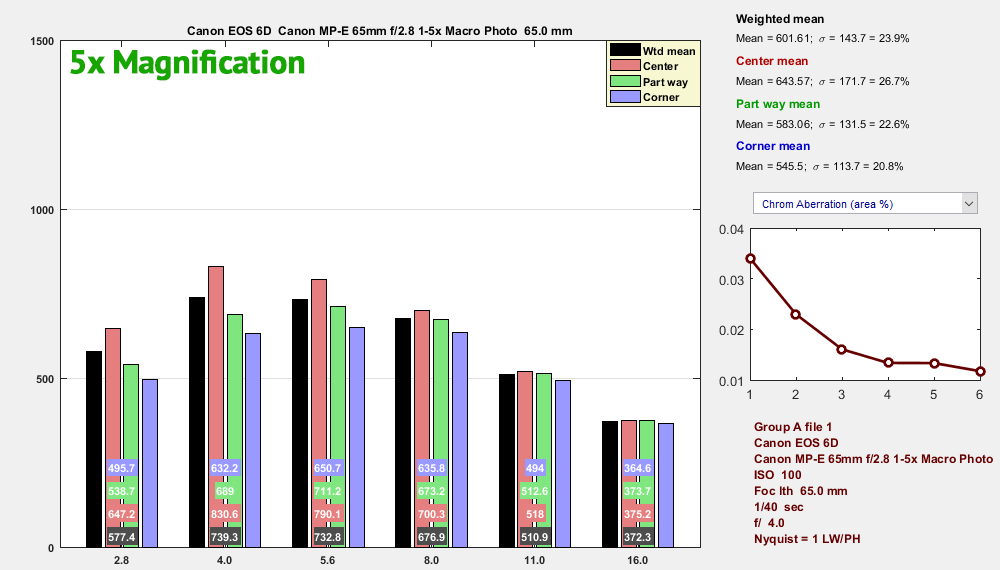
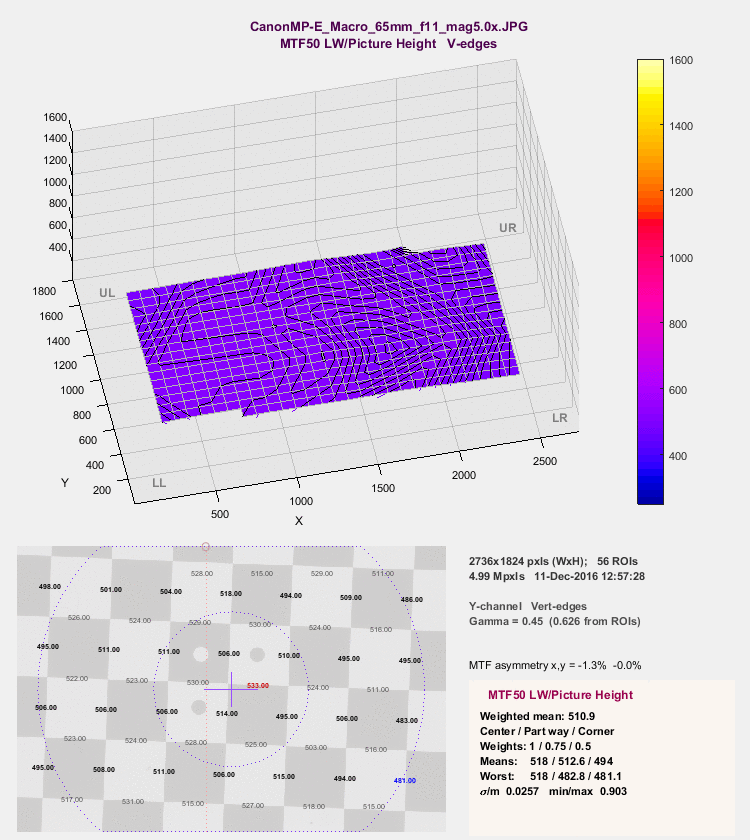
5x Magnification
At the limit of this lens’ magnification we obtain the most spatial detail on the target at f/4
Capture Procedure
We use this camera setup to take high precision photographs of the test targets on a LED lightbox:
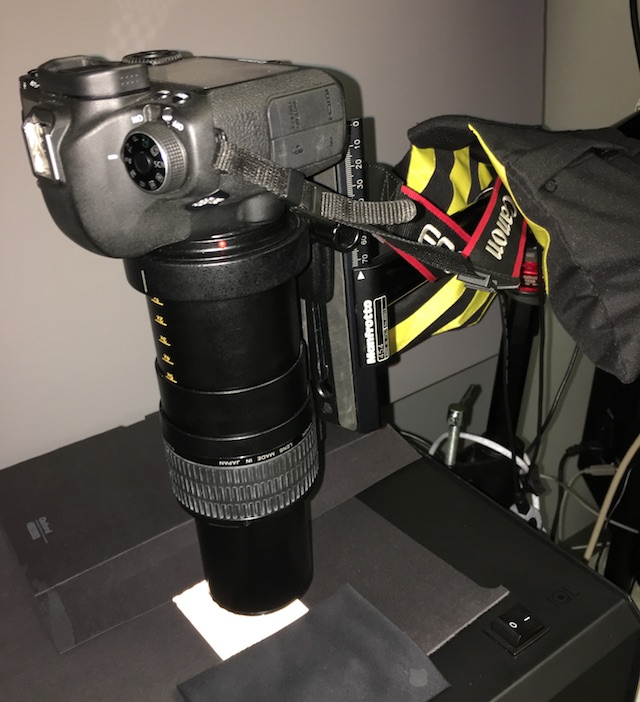
We mounted the camera on an adjustable arm and used a Manfrotto 454 Micro Positioning plate for adjusting distance and focus. We masked off the extra parts of the lightbox using opaque material to prevent additional stray light from increasing flare.
We used the following framing for the various magnifications:
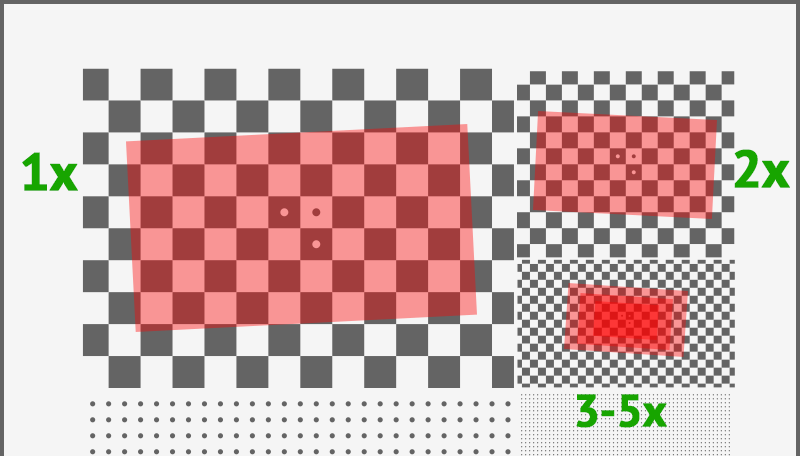
To get good sharpness measurements we selected an area of the slide that had under 10 vertical squares in the image. This yields a reasonably large SFR region for the most reliable calculations and prevents there from being an excessive number of regions.
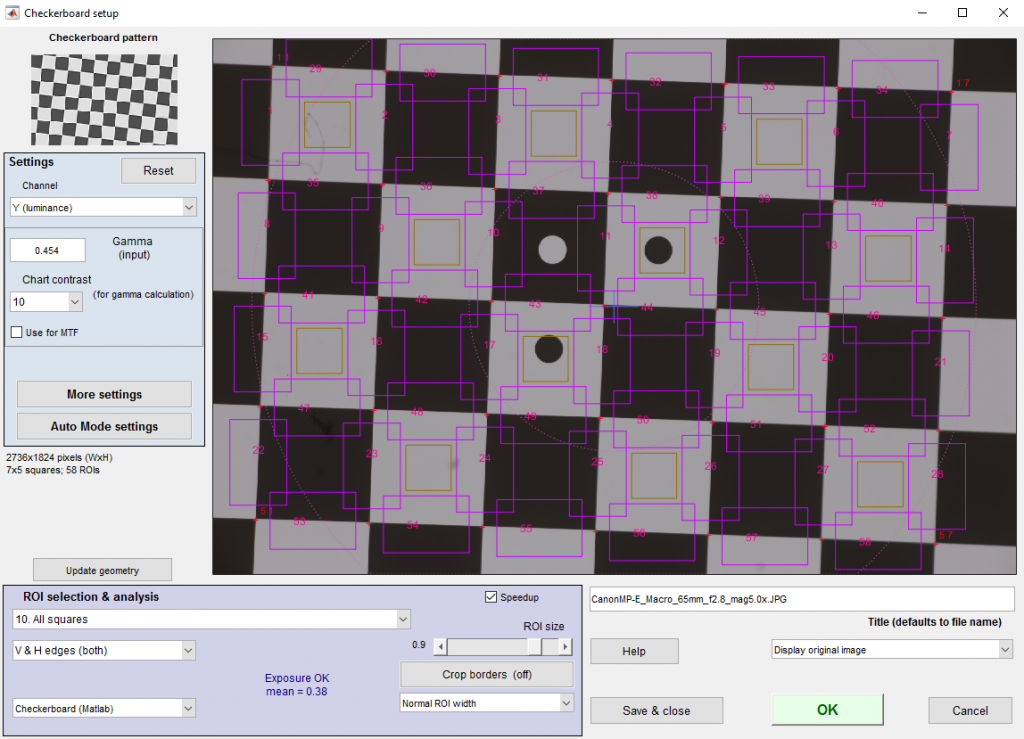
We centered the chart on the 3-dot mark in the center of the frequency zone. For optimal slanted-edge analysis, we rotated the chart by about 5° according to the ISO 12233 standard. Our current checkerboard routines can automatically detect the checkerboard, but they look for complete rows and columns before including the set of regions. Which means that rotation can make the framing a little more difficult, and if a corner of a complete row/column of squares gets clipped off, then the automatic region detection will skip some regions you may have wanted to test, producing less than optimal region availability around the periphery of your image. We will be improving these selection routines in future releases of our software.
If we wanted more detail about lateral chromatic aberration and distortion (which are very low for this lens) we would have analyzed the dot pattern regions of the chart.
We used 5 megapixel downsampled JPG’s from the camera to perform this analysis, which gives us the following table of image sizes:
| Magnification | Image height | Image pixel size |
| 1x | 23.71mm | 13µm |
| 2x | 11.86mm | 6.5µm |
| 3x | 7.90mm | 4.33µm |
| 3.9x | 6.07mm | 3.33µm |
| 5x | 4.74mm | 2.6µm |
Analysis Procedure
We performed our Checkerboard Setup and selected all regions:
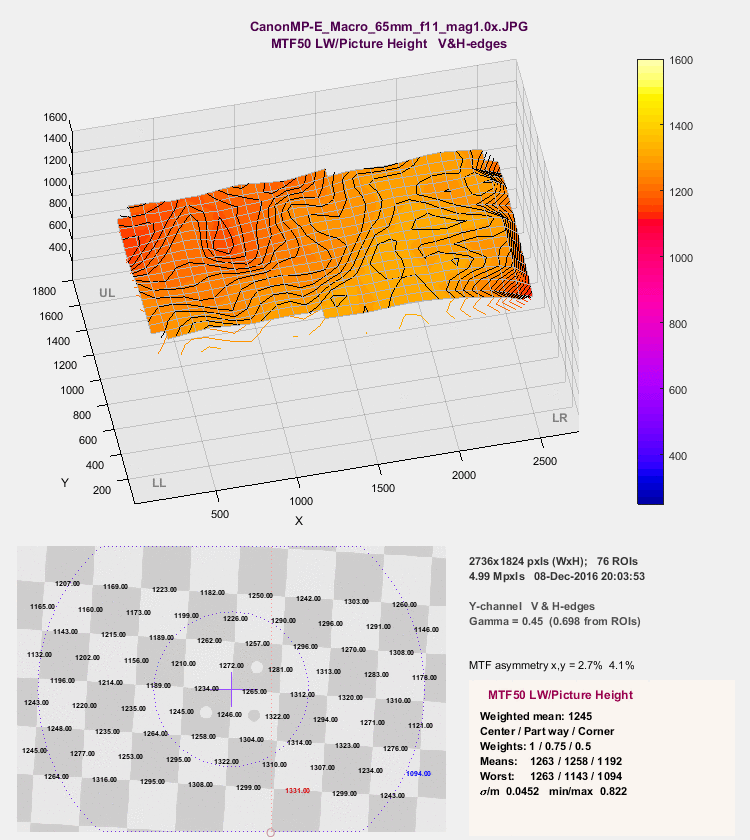
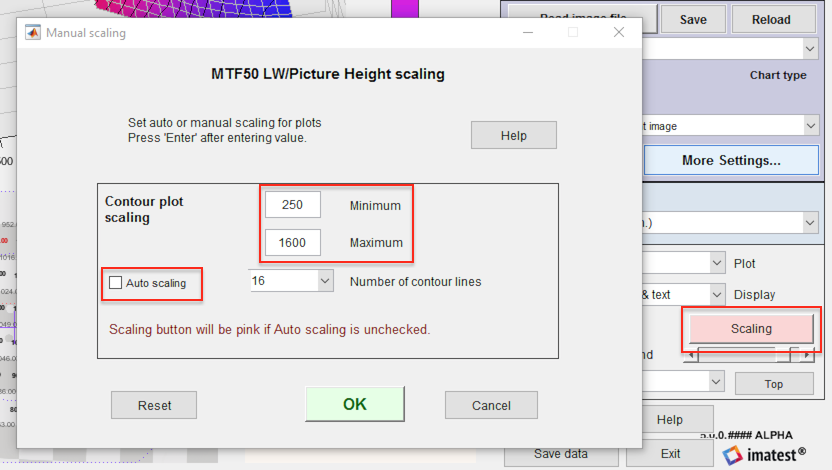
After initially determining our range of expected MTF values, we disabled auto-scaling on our 3D plots and set our range to the total:
We used Imatest Batchview to coalesce the large volume of tests in order to produce the above bar graphs. We also used ImageMagick to assemble the nifty animated GIF’s from the collections of 3D plots:
convert -delay 100 mag1/Results/*3D.png 1x-3D.gif
We hope that you find this write-up to be helpful in testing your own equipment. You can purchase Micro-multi Slide on our store or contact [email protected] for customizing a test target that fits your unique requirements. See our Macro Solutions for other close-range testing items.