|
Imatest InfoDR (Information-based Dynamic Range) refers to an Imatest module and a set of test charts designed to measure C4 information capacity over a wide range of illumination — This post, InfoDR Results, shows C4 summary results for a number of cameras. |
|
Using InfoDR, Part 1 — describes the InfoDR charts and how to photograph them. Using InfoDR, Part 2 — describes how to analyze the InfoDR charts in Imatest Rescharts and Color/Tone InfoDR, Part 3 — Results — shows C4 summary results for a number of cameras. Image Information Metrics — Introduction and overview of information capacity and related metrics, with links. Using Rescharts — Introduction to Rescharts — an interactive interface for resolution-related charts, all of which can also be run in fixed batch-capable versions. |
This post presents InfoDR results for a variety of cameras that we were able to test. In all cases, raw files were converted with LibRaw into 48-bit Adobe RGB (color space) files with minimal processing — no sharpening or noise reduction. Maximum exposure was kept a little under saturation (around -0.05 to -0.1 in units of log10(DN/DNmax). Results were mildly (but not strongly) sensitive to exposure. Saturated or near-saturated regions were omitted from the calculations. High quality lenses were used where possible, at optimum aperture (F-number): f/5.6 or f/8.
Many of the cameras were quite old, with no computational imaging or Artificial Intelligence to distort the results.
We used the first version of the 2-layer LVT film InfoDR chart. The final version may have slightly reduced “sawtooth” patterns in the lower (log(pixel level) vs. log(exposure)) plot, which are likely caused by stray light from lighter patches.
Summary table
Abbreviations: FF = Full Frame (24×36mm sensor).
| Camera | Pixel size μm |
Total Mega-pixels |
F-stop, Shutter speed |
Dyn. Range dB High, Low |
C4Δ b/p, MB total |
Description |
| Lumix LX7 | 2.14 | 10.1 | 5.6, 1/50 | 21.3, 39.7 | 2.74, 27.6 | Compact camera with Leica-branded zoom lens |
| Lumix G3 | 3.77 | 16 | 8, 1/40 | 20.3, 35.1 | 2.45, 39.1 | Micro 4/3 mirrorless interchangeable |
| Sony A6000 | 3.9 | 24 | 8, 1/20 | 35.8, 47.4 | 5.16, 125 | APS-C mirrorless interchangeable |
| Lumix FZ1000 | 2.41 | 20 | 8, 1/30 | 19, 38.8 | 2.38, 47.8 | 1″ sensor with extreme zoom lens |
| Sony A7Rii | 4.51 | 42 | 8, 1/20 | 38.1, 49.8 | 5.78, 245 | Mirrorless, FF BSI sensor |
| Sony A1 | 4.16 | 50 | 8, 1/20 | 37.9, 53.1 | 5.6, 281 | FF Stacked sensor [A] |
| Sony A9 | 6.19 | 24 | 8, 1/20 | 40.4, 53.9 | 6.19, 150 | FF Stacked sensor [A] |
| Pentax K-1 | 4.88 | 36 | 8, 1/30 | 38.6, 51.2 | 5.7, 207 | FF [B] |
| Pentax 645Z | 6.58 | 51 | 8, 1/25 | 42.5, 57.2 | 6.58, 337 | Medium Format [B] |
| Leica M9M | 6.92 | 18 | ?, 1/60 | 28.8, 44.5 | 3.87, 70 | FF monochrome rangefinder. Some misfocus or lens misalignment? [B] |
| Pixel 8 Pro 12.5 Mp | (2.4) | 12.5 | 1.7, 1/114 | 42.7, 79.1 | 6.89, 86.3 | Same (phone) camera, different settings. 4 (2×2) pixels averaged to get 12.5 Mp. |
| Pixel 8 Pro 50 Mp | 1.2 | 50 | 1.7, 1/88 | 39.8, 46.2 | 4.95, 248 | |
| iPhone 15 Pro Max | 1.22 | 48.8 | 1.8, 1/122 | 53.5, 73.9 | 5.4, 263 | Overall impressive performance. |
Interesting as the results are, we didn’t find any major surprises (though there were some small surprises for the camera phones). High quality (expensive) cameras seemed to deliver on their promise.
Thanks to Bruce Henderson [A] and Shel Gottlieb [B] and for bringing in cameras to test.
Detailed results
The file name in the top line of each image contains the camera model name, focal length, aperture (f-number), ISO speed, and exposure time with ‘/’ replaced by ‘-‘ (for example, 1/30 second is ‘s1-30’.
To compare results, please note that the x and y-axis scales are different for different plots, i.e., you need to look at the (automatic) scale or C4Δ = ∑C4ΔD, which is a preliminary heuristic summary metric that combines C4 and dynamic range. C4Δ is the area under the C4 curve in the plots below. ΔD = 0.2 for the two layer film chart is the density increment between data points — identical to the increment of Log10(Exposure H).
Panasonic Lumix LX7 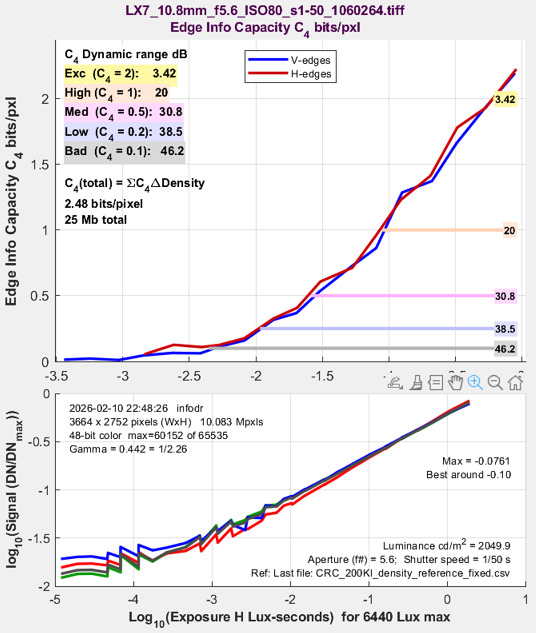 Leica zoom, non-interchangeable Leica zoom, non-interchangeable |
Panasonic Lumix G3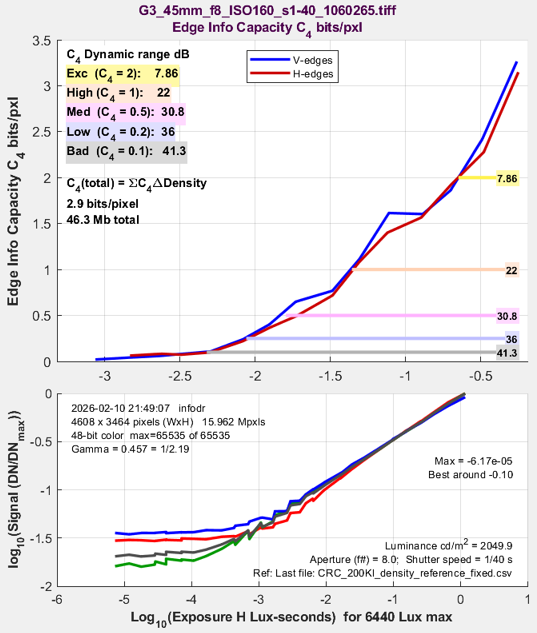 |
Sony A6000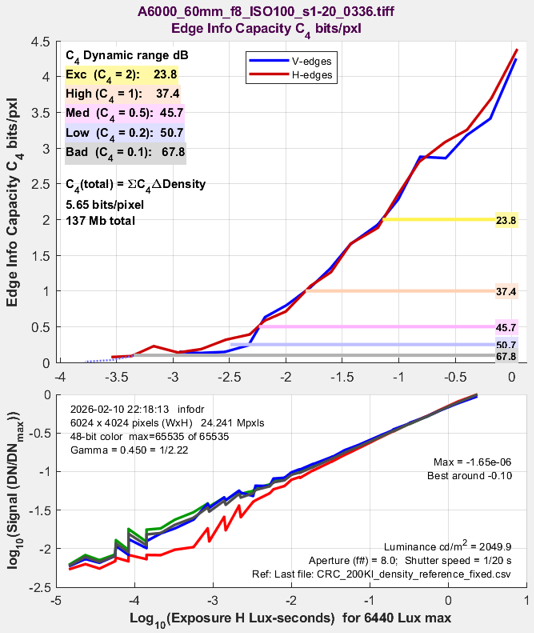 Canon 60mm f/2.8 macro lens with full manual control, allows the magnification to be set. We use it for testing our test charts. Exceptionally low stray light. Canon 60mm f/2.8 macro lens with full manual control, allows the magnification to be set. We use it for testing our test charts. Exceptionally low stray light. |
Panasonic Lumix FZ1000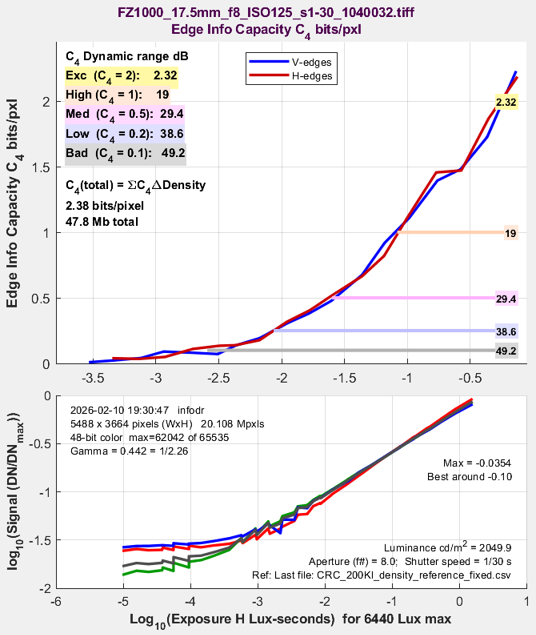
Leica-branded extreme zoom. 1″ sensor. Non-interchangeable. 25-400mm equivalent. |
Sony A7Rii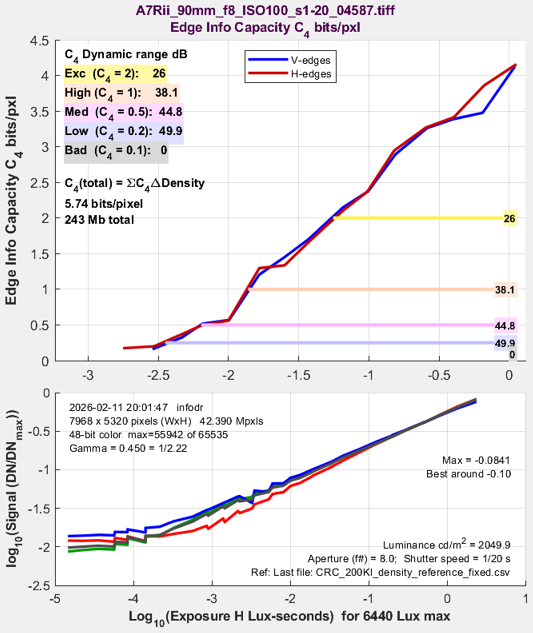 The three Sony Full-Frame cameras (A7Rii, A1, and A9) used the same lens: the excellent Sony 90mm f/2.8 macro at f/8. Low stray light. The three Sony Full-Frame cameras (A7Rii, A1, and A9) used the same lens: the excellent Sony 90mm f/2.8 macro at f/8. Low stray light. |
Sony A1 Thanks to Bruce Henderson 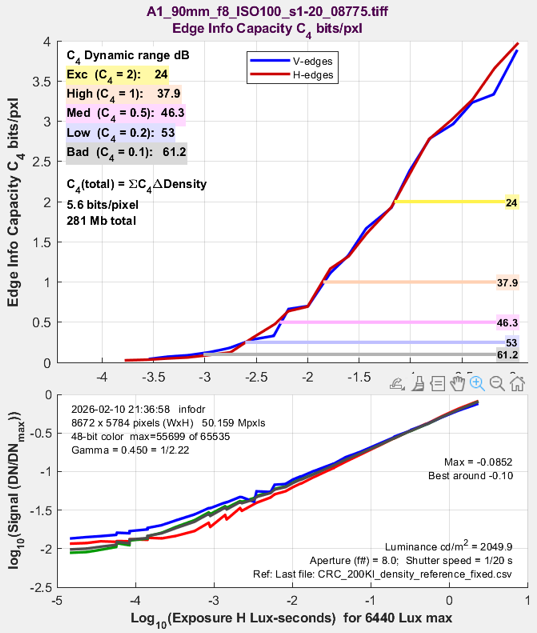 |
Sony A9 Thanks to Bruce Henderson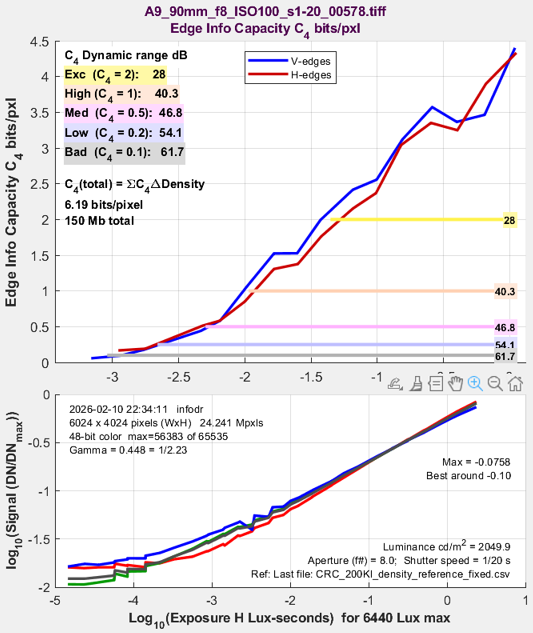 |
Pentax K-1 Thanks to Shel Gottlieb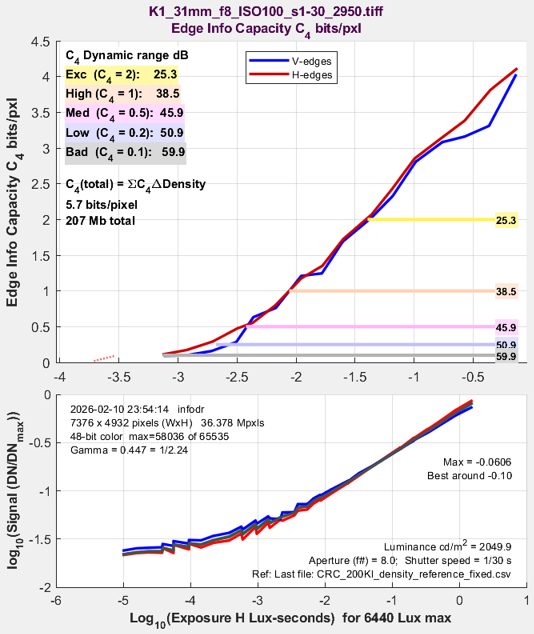 |
Pentax 645Z Thanks to Shel Gottlieb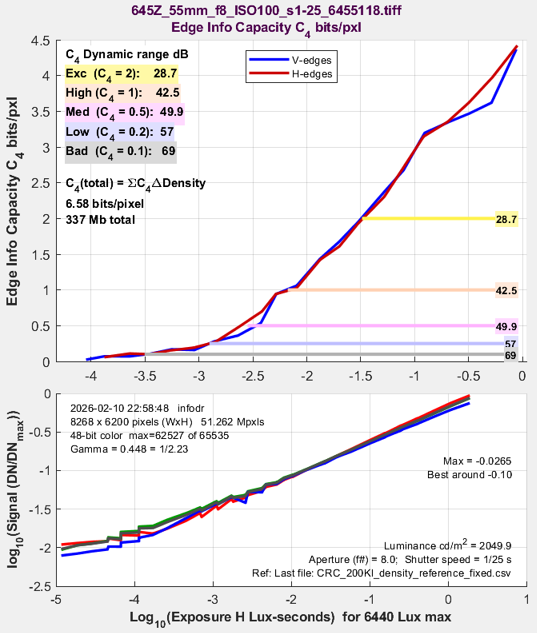 |
Leica M9M Thanks to Shel Gottlieb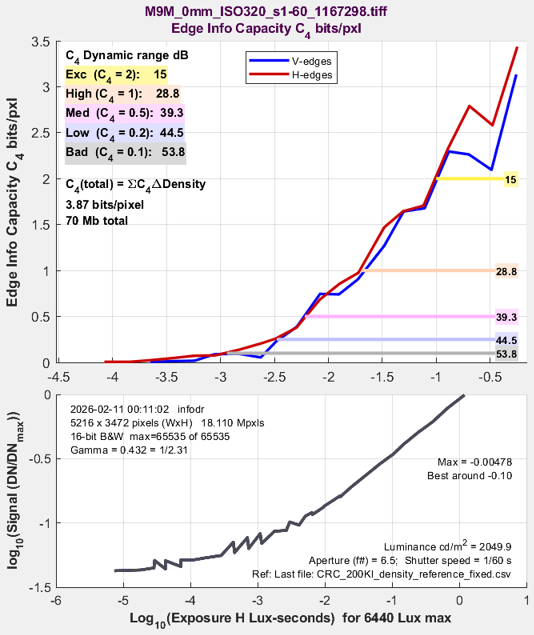 Cause of C4 bump is unknown. There seems to be some misfocus and perhaps misalignment. The lens was a Leica 35mm f/2.8 Summaron, manufactured from 1958-1974. Cause of C4 bump is unknown. There seems to be some misfocus and perhaps misalignment. The lens was a Leica 35mm f/2.8 Summaron, manufactured from 1958-1974. |
| Pixel 8 Pro 12 Megapixels |
Pixel 8 Pro 50 Megapixels |
|
MTF50 as a function of illumination for the Pixel 8 Pro, 50 Mp The Google Pixel 8 Pro (phone) camera is different from all the previous cameras. Although it has a “Raw” mode, it employs significant computational imaging, so that each exposure consists of multiple short exposures, aligned and averaged to improve SNR. The default 12.5 Megapixel setting (left) is obtained by averaging groups of 4 (2×2) pixels. The full resolution 50 Mp result is shown on the right. C4Δ is remarkably high, but not realistic because MTF50 falls off dramatically away from the center. (It’s an experimental metric, subject to change.) The bumps on the (upper) C4 plots could be caused by reflections, by the way images are combined (this happens with HDR images), or by rapid falloff of MTF from the center. The cyclic behavior of MTF (on the right for the 50 Mp version) is a clue. But close examination (right, below) makes it apparent that the cause is very rapid falloff of MTF from the edge. |
|
The assumption that MTF would be consistent if the active area of the chart were kept in the central portion of the image failed in this case. MTF fell off rapidly from its peak value. The minimum log(DN/DNmax) of the Pixel 8 Pro of around -1.2 is higher than the others, likely because of stray light (veiling glare), which was “glaringly” visible on overexposed images. |
|
iPhone 15 48.8 Megapixels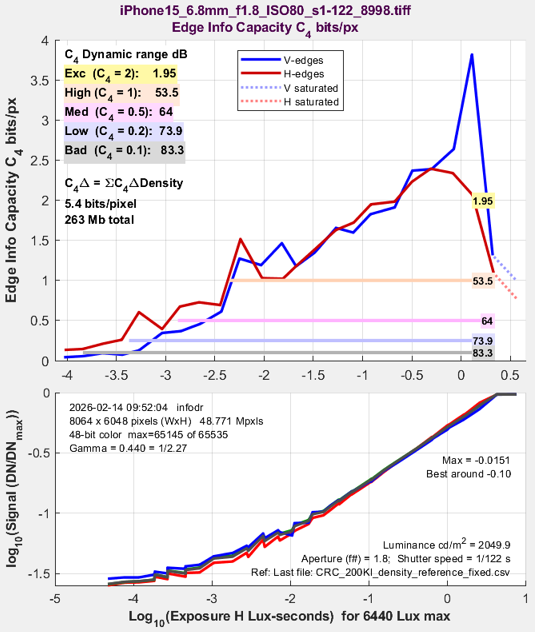 |
The iPhone 15 had remarkable performance, with high values of C4 over a wide dynamic range, for C4Δ = 5.4 bits/pixel. It appeared to have less MTF falloff than the Pixel 8P, but — something we haven’t seen in other raw files — the “raw” file showed definite signs of noise reduction in the form of a peak in the spatial-dependent noise response. It had less stray light then the Pixel 8 Pro. It evidently employs significant computational imaging, likely combining multiple exposures. Overall impressive performance. |
