Overview
Why Imatest? | Test Charts | Lighting | Image Capture Technique | Setting up Your Lab | Using Imatest Software
If you are getting started with Imatest — or need a good reference on using it — we recommend Imatest Instructions– Getting started.
Why Imatest?
Introduction
Imatest charts and software allow you to measure the characteristics and quality of cameras and imaging systems. To begin measuring the resolution or color of your camera, you’ll need an image of a test chart. Imatest offers all-in-one test charts that can test a wide variety of image quality factors with one image. We also offer specialized test charts for measuring system properties like dynamic range, or signal processing properties such as noise removal.
A proper testing workflow is mandatory for obtaining reliable measurements. Imatest measurements help users to understand the impact of each component on overall system performance. To get started using Imatest software, read the installation instructions.
Digital Photography and Image Signal Processing (ISP)
Capturing an image with a digital camera records raw sensor data. Each pixel on the sensor records a light value, in a pattern of red, green, and blue filters. Before a resulting photo can be viewed, complicated signal processing is performed. ISP algorithms determine each pixel value by “demosaicing” a raw bayer file.
Imatest can determine the effects of ISP on image quality factors such as sharpness and noise. The effects of lens properties, or other system characteristics like dynamic range, can be determined by testing raw files. Imatest handles most image file formats - both raw and processed.
Imatest Helps Improve Image Quality
Beyond measuring the limits of your system performance, Imatest also can help you improve image quality. Optimize the signal processing of your own imaging system by applying distortion correction coefficients provided by Imatest.
Read the following post to learn how Imatest can help you “Close the Loop.”
Test Charts
Test Chart Setup
Using the right collection of Test Charts is crucial for obtaining comprehensive image quality measurements. It is important to choose the right chart size and substrate for your image quality testing needs. For instance, companies in the Automotive industry typically need to perform resolution and distortion tests for Wide Field of View applications.
Test charts are produced on a variety of substrates, including reflective and transmissive material. Transmissive targets can be produced with significantly more detail than reflective surfaces. It is important to remember that the resolution of the target must significantly exceed the resolution of the imaging system. Otherwise, the resolution of the target will impact the measurement. The main advantage of the reflective prints is the ability to produce them at lower cost and at larger sizes. Calculate the ideal test chart size for your lab and receive chart recommendations with the Imatest Chart Finder. See the Test Setup knowledge base for more details on using test charts.
Multi-Feature Test Charts
Multi-Features test charts allow for testing of many image quality factors with one image. Below is a comparison of our flagship eSFR ISO and SFRplus test charts.
|
eSFR ISO
|
SFRplus
|
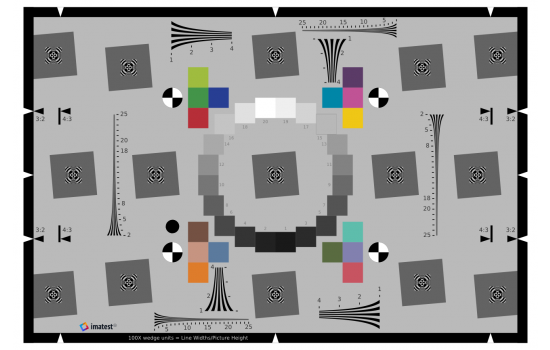
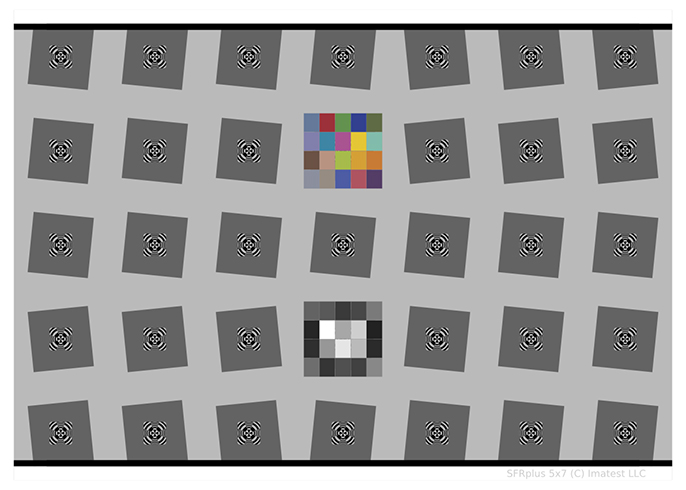
Image Quality Factors Tested By All-in-One Charts:
- Resolution / MTF / SFR
- Geometric Distortion and Tilt
- Chromatic Aberration (CA)
- Tonal Response and Gamma
- White Balance, Color Response, Color Error
- ISO-Standard Noise, SNR, Dynamic Range
- Both test charts offer automated region detection
- Customization available through consulting services
Other Test Charts:
Checkerboard
Checkerboard Test Charts supply more testable regions to provide measurements of sharpness, lateral chromatic aberration, and distortion. Chrome on Glass Checkerboard Targets are also available in the "NIR and Visible" category for macro testing, which is of particular interest to the medical industry.
Wide Field of View
Moderate distortion often occurs in images captured with a small focal length, or wide field of view. Pre-distorted Test Charts are available for wide field of view cameras or (“fisheye“) lenses with extreme barrel-distortion. When the field of view of your imaging system extends beyond 160º, a planar target is less reliable because extreme distortion will occur. Instead of using a single test target, SFRreg Test Chart targets are available for testing sharpness at arbitrary locations in the imaging plane. Imatest also offers the Ultra-Wide Field of View Test Fixture for 180° FOV image testing with back-lit targets at pre-defined locations.
Dynamic Range & Contrast Resolution
36-Patch Dynamic Range Test Charts provide testing solutions for low dynamic range (standard mobile devices), wide dynamic range (DSLR cameras or HDR settings), and ultra-high dynamic range (composite image) systems. Dynamic Range Charts also provide detailed noise and tonal response measurements. Contrast Resolution Test Charts are useful for the visualization and measurement of contrast separations, which is used to determine how observable objects are. This is of particular interest to companies in the automotive and security industry, where object recognition is crucial. Both of these charts must be paired with transmissive lighting. An Imatest LED Lightbox is recommended.
Noise & Tonal Response
ISO-15739 Digital Camera Noise Test Charts and ISO-14524 Digital Camera Contrast Test Charts are available for detailed noise and tonal response measurements under reflective lighting.
Signal Processing
The Spilled Coins Cross Test Chart uses cross-correlation calculation texture metrics to provide improved stability for images with nonlinear noise reduction. This allows for more accurate differentiation between noise and texture. Log Frequency Contrast Test Charts can also be used to measure the effects of signal processing: noise reduction and sharpening.
Distortion & Chromatic Aberration
Dot Pattern Test Charts and Checkerboard Test Charts provide more detailed distortion & lateral chromatic aberration measurements than all-in-one test charts. While Checkerboard is typically sufficient, Dot Pattern provides the most complete map of lateral chromatic aberration and is not affected by a tilt angle.
Color
The X-Rite ColorChecker Classic Chart is the industry standard for color calibration due to its size and reliability. In cinema, color calibration is particularly important when filming with multiple cameras. Imatest provides a color correction matrix for the X-Rite ColorChecker, along with the extended X-Rite ColorChecker SG version. The Rez Checker Target is also available for color error measurement with extreme close up or macro imaging. In the medical industry, accurately representing color can be crucial for applications such as endoscopes.
Uniformity
A uniform image, free of light falloff and color variation, is highly desirable in digital photography. To test uniformity, a flat, uniform light source is used as the testing target. The uniform light source must fill the entire image. If possible, the lens should be focused at infinity to avoid measuring any blemishes that may be present on the surface of the light source. We recommend the Imatest LED Lightbox, or for a wider range of light spectrum capabilities, the Gamma Scientific RS-7 Uniform Light Source.
Flare
The Backlit ISO 18844 Flare Test Target is used for testing flare according to the ISO 18844 standard (part c). It includes a mylar photomask with black patches to minimize reflection, and it can be easily mounted on the Imatest LED Light Panel.
Automotive
ISO 16505 Test Charts are a collection of 6 charts mentioned in various parts of the ISO-16505 standard for Road vehicles — Ergonomic and performance aspects of Camera Monitor Systems.
Lighting
Reflective Lighting
When using reflective test charts, uniform, glare-free illumination is essential for achieving accurate, repeatable measurements. Reflective lighting is a key capability offered by Imatest. Use standard CIE illuminants like T55 (daylight), or TL84 (fluorescent) to determine exactly how your imaging system responds to various lighting conditions. LED and fluorescent bulbs provide approximations of CIE illuminants but do not contain near-infrared energy (over 730nm) that would be present in actual daylight. However, most digital camera sensors include near-infrared cutoff filters, so this is less of a concern.
A light meter should be used to verify that light intensity varies no more than ±20% over the entire target for SFR and Distortion measurements. For tonal and color measurements, light intensity should vary no more than ±5%.During testing, record the light intensity and color temperature record for later reference.
Transmissive Lighting
Because transmissive substrates can produce a wider range of tones, transmissive lighting should be used for testing the dynamic range of your imaging system. Transmissive lighting also provides a uniform light source for testing uniformity. When reflective chart quality is not sufficient for your testing needs, transmissive charts can also provide a solution for ultra-high resolution. During testing, record the light intensity and color temperature for later reference.
Reflective Substrates:
Inkjet - Matte / Semigloss
- Inkjet printed on paper is the most widely used medium because the size of the target is easily customized
- Ideal for testing lenses and imaging systems with longer focal lengths
- Minimum Size: 8" x 10"
- Maximum Size: 44" x 80"
- Larger sizes possible with tiling
Photographic Paper - Silver Halide
- Over 2x the resolution of Inkjet
- Three standard sizes: 1x, 2x, and 4x
- Minimum Size: 8" x 12"
- Maximum Size: 32" x 48"
- Custom sizes available
Transmissive Substrates:
Photographic Film - Silver Halide
- Over 2x the resolution of Inkjet - more sharp than Photographic Paper
- Must be used with a transmissive light source
- Ideal for testing dynamic range
- Two sizes available: 12" x 20", 44" x 80"
- Larger sizes possible with tiling
Chrome on Glass - Photomask
- Sharpest medium for resolution testing
- Single tone - no tonal variance
- Three standard sizes: 4" x 4", 2" x 2", 1" x 3"
- Larger sizes up to 20" x 20" possible with an engineering fee
Uniform Light Source
- Up to 97% uniformity for testing light falloff and color non-uniformity
- Adjustable color temperatures 2700K - 6500K
- Adjustable light intensities up to 100,000 Lux
- Available in near-infrared (NIR) spectrum
Image Capture Technique
Imaging System Alignment
To ensure dependable measurements, the lens of your camera or imaging system must be centered and orthogonal to the test target. The chart should fill nearly the entire field of view. The outer edges of the imaging plane are often the greatest area of concern to the end user, as light falloff and defocusing occurs in many optical systems. Imatest plots include detailed results for sharpness across the entire imaging plane. The lens to chart distance must be recorded for some reports like CPIQ, which determines image quality based on viewing size.
Focusing
Focusing should be done precisely and carefully. To find the optimal focus for your camera, capture images with incremental focus adjustments as you document the exact position of your lens. Running these images through Imatest can help you determine which alignment is best for your imaging system. Imatest can also analyze the autofocusing and auto exposure functions of your camera. This measurement can be calculated by loading a video recording of the test chart into Imatest. An SFRreg target can be focused at close distance and quickly removed to test the speed of autofocusing rise and fall. In many cases, digital imaging systems rely on autofocusing algorithms to capture a sharp image. Use Imatest to ensure that your system has reliable, fast-acting autofocus.
Other lens properties can also effect focusing capability. Lens performance is a strong function of the aperture (f-stop) and focal length (for zooms). Be sure to record these settings (easy because they’re saved with the EXIF data) and include them in your write-up. The optimum (sharpest) aperture is of particular interest. Lens performance is also somewhat affected by the distance to the target.
Image Capture
Test images should be recorded in a controlled fashion. For static tests, the shutter should be triggered remotely, on a timer, or with a cable release to eliminate variance from shaking. A sturdy tripod should be used. Imatest also offers Motion Generators to test the effects of motion on image quality.
Lens surfaces should be clean, and the lens to chart distance should be recorded for later reference with test manager or another module. Use RAW, TIFF, or the highest JPEG quality. Never use less than the maximum resolution or JPEG quality unless you are specifically testing the effects of these settings. White balance should be as close as possible to neutral. Proper exposure is important: take care not to clip shadows or highlights. Clipping occurs when pixels fall outside the range at which they can be displayed. When clipping occurs on both sides of the histogram, the scene’s dynamic range is too high for the camera system.
Setting up Your Lab
A proper testing lab setup is essential for obtaining reliable, repeatable image quality measurements. Imatest offers solutions for a wide variety of industries such as automotive, medical, and consumer electronics. Imatest can help you determine the ideal test charts and lab equipment for your image quality testing needs.
Click the button below to set up your image quality testing lab with the right equipment.
Using Imatest Software
If you are getting started with Imatest — or need a good reference on using it — we recommend Imatest Instructions– Getting started.
Getting Results
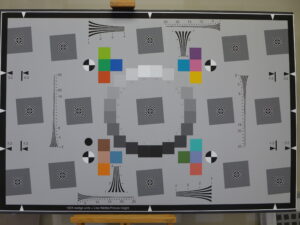
Actual Test Image Captured in the Lab
To evaluate the performance of your imaging system, the correct module must be selected according to which chart is used as the testing target. An image of an eSFR ISO chart will be used in this example.
In the image to the right, the chart is illuminated evenly, and no reflections are visible. Imatest can analyze the resolution, color temperature, chromatic aberration, and geometric distortion of this image. To begin obtaining results from Imatest software, read the following instructions on Using eSFR ISO.
Reading Sharpness Measurements
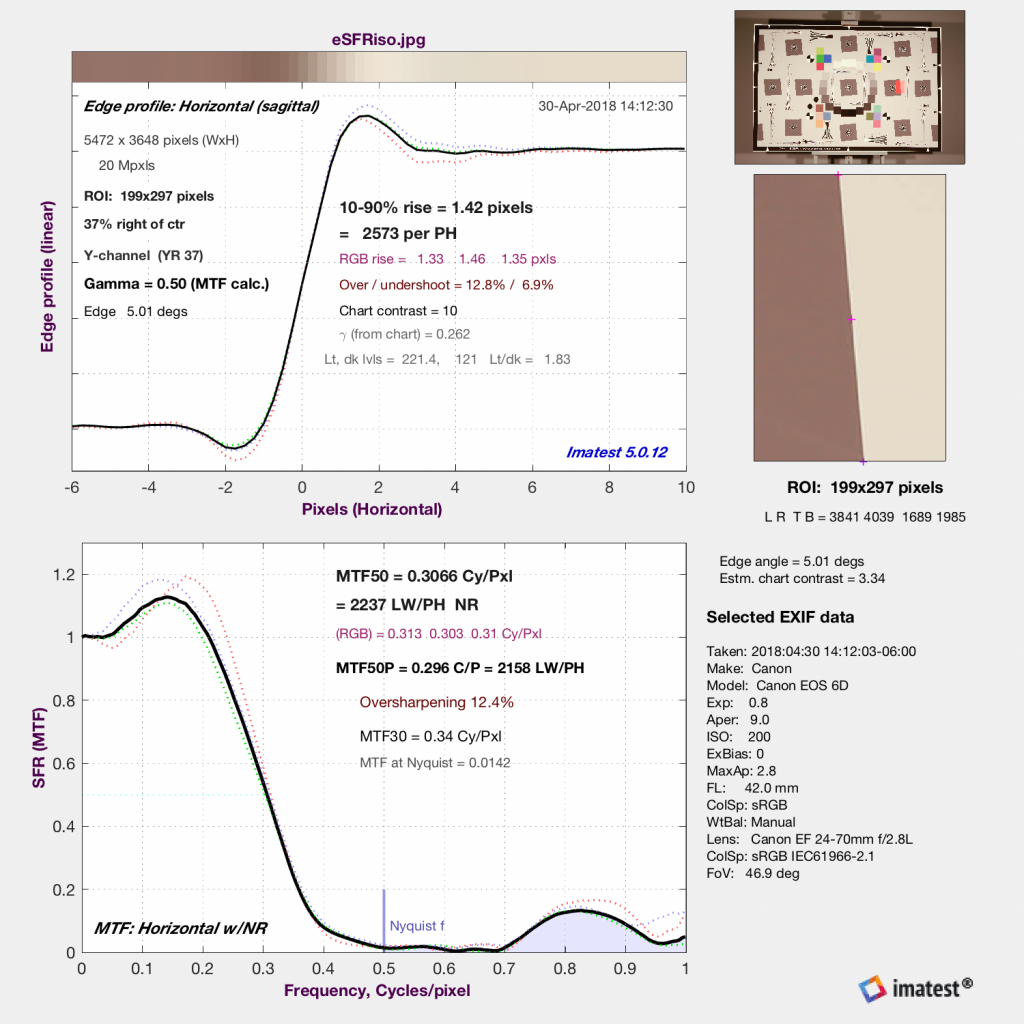
Example plots from a single slanted edge using the eSFR ISO module
Sharpness is arguably the most significant image quality factor because it determines the maximum detail that can be reproduced by an imaging system. The most efficient way to measure sharpness is with slanted edges. They enable quick and accurate measurements at many precise locations in an image.
The image to the right shows an edge profile (upper curve) and SFR plot (lower curve) of a single slanted edge.
The Modulation Transfer Function (or MTF) is a fundamental measurement of an imaging system’s ability to capture a scene’s sharp details. Often used interchangeably, Spatial Frequency Response (or SFR) is defined as system MTF. MTF50 is a commonly used metric which summarizes an MTF curve. MTF50 is the spatial frequency where the system response is fifty percent of the baseline low frequency. MTF plots can quickly indicate whether an image is blurry or over-sharpened, which are typically undesirable for digital imaging.
For more information on Edge and MTF (Sharpness) plots, read the post on MTF Curves and Appearance.
For instructions on obtaining image quality metrics and using Imatest modules, refer to Imatest documentation.
Manufacturing Testing Pipeline
Learn the best practices for managing supply chain image quality with Imatest by watching the following webinar: Automating Lab & Manufacturing Processes. The webinar provides tips and tricks for integrating test software to run on automated test equipment during production.
