The release of Imatest 5.0 introduced a number of powerful new features, including the Arbitrary Charts module which enables Imatest analysis of test chart designs which would be otherwise unsupported by the software. This new module allows user-defined chart layouts for any situation which requires one.
The primary concept of Arbitrary Charts is that the user supplies a chart-definition text file which declares the location and properties of features on a test chart. The features can be placed in essentially any configuration and Imatest will still be able to automatically analyze the chart.
Here at Imatest, we believe we’ve designed some very comprehensive test charts, such as our flagship SFRplus and eSFR-ISO charts. These charts are designed to provide a number of image quality factor measurements, work with an extremely wide range of cameras, are available in pre-distorted versions for wide-angle lenses, and more. They each have their own dedicated modules in Imatest which recognize these chart designs.
While we highly recommend the use of these and our other standard charts, we also recognize that there are situations which may require a more custom target. For example:
-
Working with a legacy database of test images of an older chart
-
Meeting a test spec which requires specific, non-standard targets
-
custom reticles for collimator systems
-
Special combination charts for accelerated testing
P1858 Combination Chart Conception
As mentioned above, some situations require a custom target, including the need to combine charts for accelerated testing. Early in 2017, a customer and frequent collaborator approached us about adding support for a new chart. The IEEE p1858-2016 Cell Phone Image Quality standard requires images of at least five different standard test charts for the complete set of seven metrics. The customer wanted to significantly reduce the need for several charts by developing a test chart that provides a “good enough” measurement of all of the metrics from a single image. We worked together with them, jointly developing what would become the P1858 Variation Combo Chart and the Arbitrary Charts Module.
The immediate goal in this case was to reduce testing time of a device by at least a factor of five. (This is likely a low bound on the time savings, as switching between test targets is typically the most time-intensive part of a well-tuned automatic test bench.) The customer wanted results that, even if they weren’t technically in spec, would provide an indication of how a test device would score on a full-fledged CPIQ test, and wanted them to be produced quickly.
This would, of course, require a set of compromises on the CPIQ metrics:
-
SFR measurements from just outside of the center of field, instead of dead center
-
24 color patches based on the X-Rite ColorChecker instead of the 140 of the ColorChecker SG
-
Color Uniformity results measured from the chart background areas between the other features, rather than an entire flat-field image
-
Chromatic Aberration and Geometric Distortion measurements from slanted edges around the field, instead of the dot pattern
These changes from the CPIQ spec were deemed acceptable for this purpose, and the P1858 Combination Chart was born. This design is now publically available, with the approval of the original customer.
Using the Arbitrary Charts Module
We have been very happy to collaborate with Imatest on their new 5.0 release to allow us to design a combination chart that reduces our objective metric capture needs, improving our productivity and eliminating the challenge of correlating data from multiple capture conditions.
– Lead Imaging Scientist, Imatest Customer
At first glance, the P1858 Combination Chart looks very similar to Imatest’s standard eSFR-ISO chart.
-
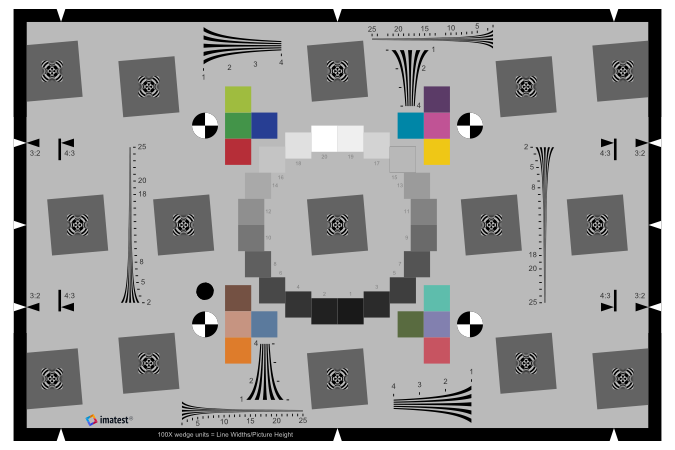
Imatest eSFR-ISO Chart
-

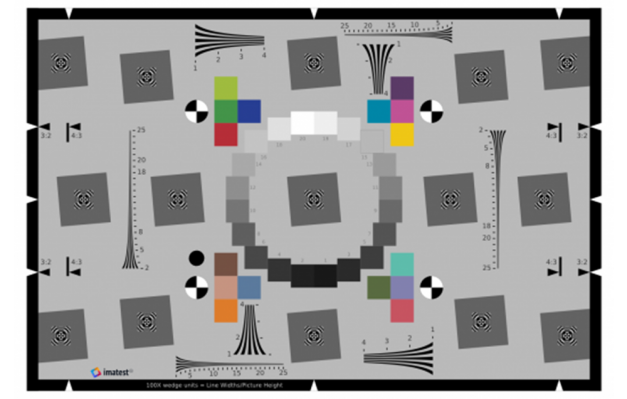
P1858 Variant Combination Chart
The most obvious difference here is that there is the dead leaves texture pattern in the center of the chart instead of a slanted square. However, there are many other subtle differences which would make this completely unusable by our standard eSFR-ISO module:
-
The grayscale OECF patches have been enlarged and moved outward
-
Extra color patches have been added to approximate all of the patches on the X-Rite ColorChecker
-
Four individual slanted edges have been added on the inside of the OECF patches, so SFR measurements are still possible near center of field
-
In general, the positioning of wedges and slanted squares is different
These differences preclude any standard module in Imatest from performing an automatic analysis of the chart (though selections of slanted edges and wedges could be made manually in individual images using the SFR and Wedge modules, respectively – not a great solution).
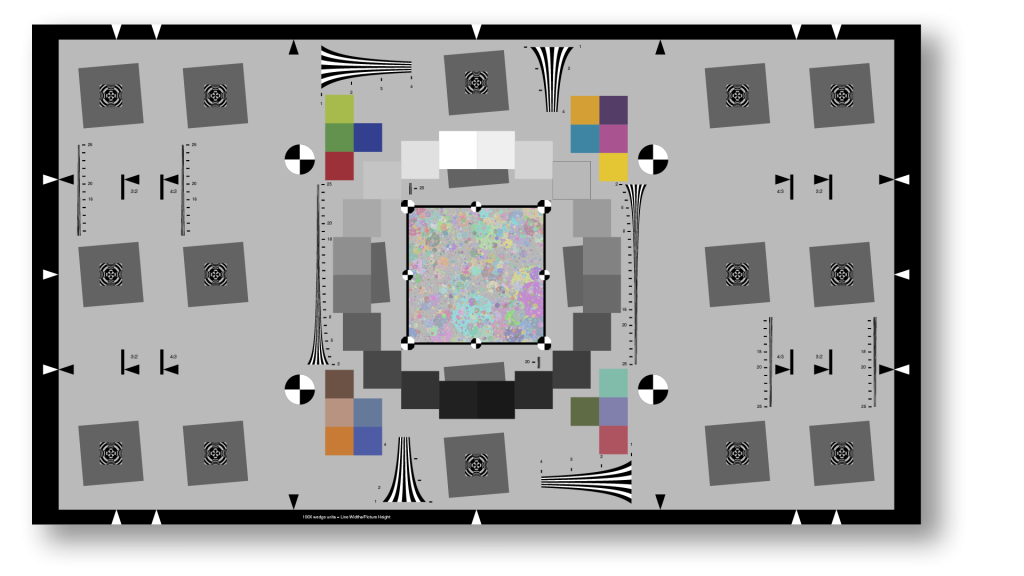
Fortunately, this chart was designed in concert with the development of the Arbitrary Charts module, with the express purpose of making analysis of this sort of chart automatic and systematic. Moreover, not only can the combined results be produced from a single image but they are produced from a single module run in Imatest. Instead of running a module to analyze the color, a module for sharpness, a module for uniformity, etc., the Arbitrary Charts module simplifies the testing procedure and output parsing.
The ability to configure our own charts is revolutionizing our approach to quantitative image quality testing and test development.
-Lead Imaging Scientist, Imatest Customer
As an added bonus, the customer is able to make slight changes to this design at will and simply update the chart definition file supplied to the module, without having to wait for new builds of Imatest to catch up.
Learning to Use Arbitrary Charts
The capability to analyze user-defined charts is new in Imatest 5.0, and is under continual development. New capabilities are being added to the Arbitrary Charts module with each release.
Further information about the Arbitrary Charts module and its current capabilities can be found on its documentation page.
The most important novel aspect of working with this module is the introduction of the chart definition file which enables the software to understand images of the test chart. To help communicate the role and construction of this file, we are producing a series of short videos that describes the process.