Year: 2017
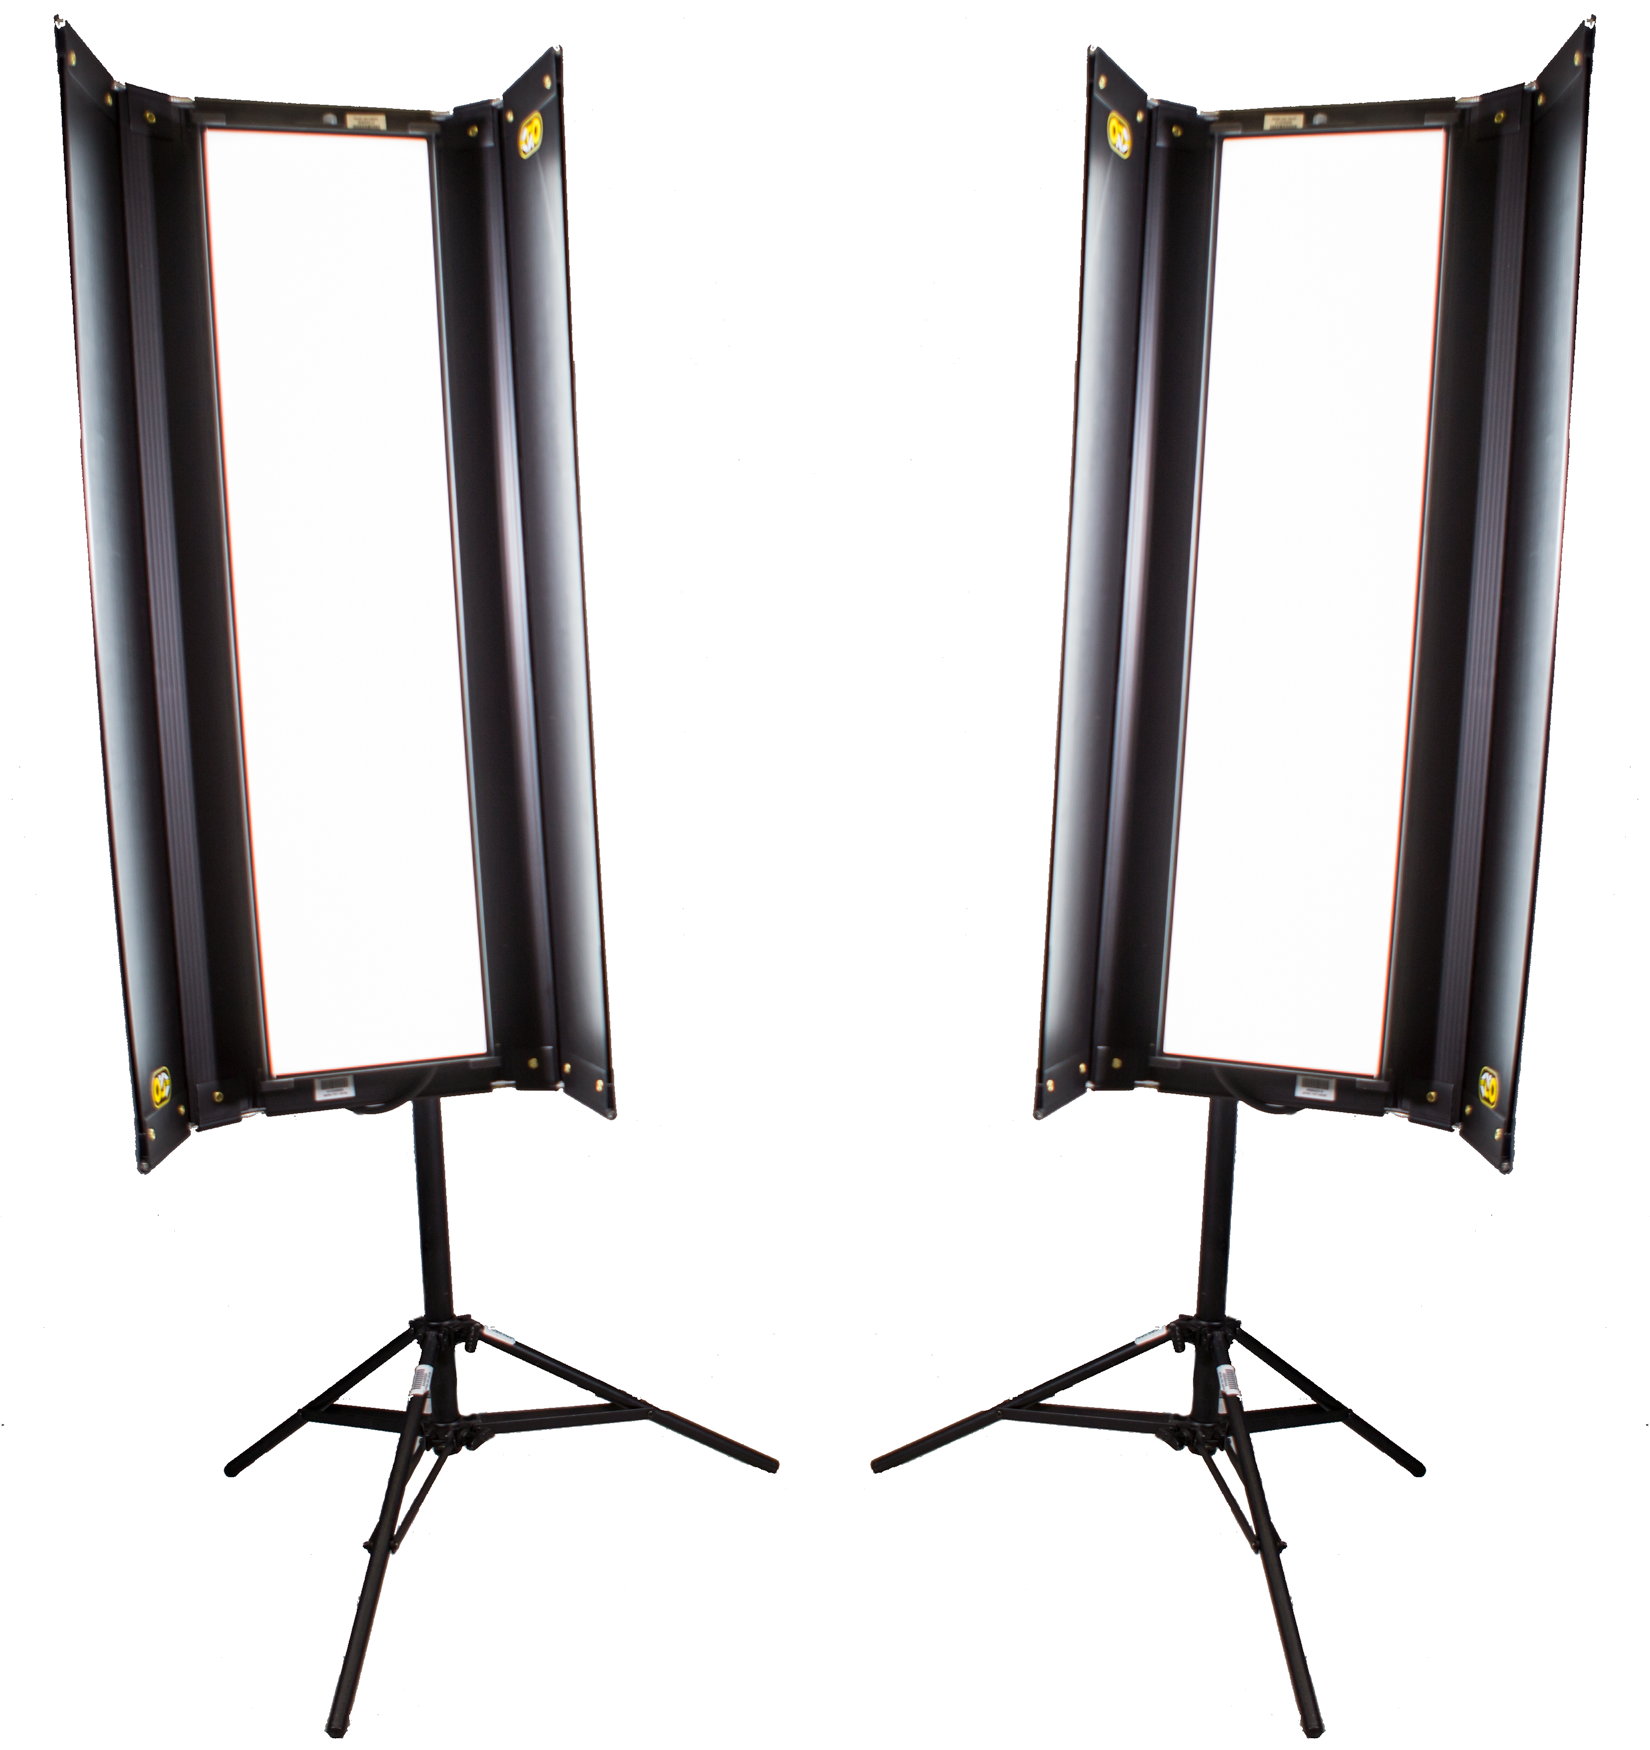
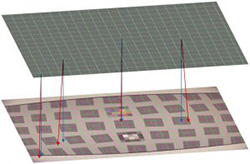
Avoiding reflections on transmissive charts for dynamic range and flare testing
The testing of dynamic range and flare requires a proper test chart and environmental setup to get accurate results.High precision […]
DMX Lighting Control Software
Lights such as the Kino Flo Select 31 LED use a DMX control interface to signal changes of light level […]
Error in Extracting CTF file
Error Message: Error in extracting CTF file to ‘C:\ProgramData\Imatest\mcr_cache\4.5\Master\mcrCache9.0.1\imates0’. Details: ‘Could not set last modified time: C:/ProgramData/Imatest/mcr_cache/4.5/Master/mcrCache9.0.1/imates0/toolbox/imaq/imaqextern/drivers/win64/genicam/genICam_v2_4/redist/Microsoft_VC80_CRT_x86_x64.msi: Broken pipe Solution: […]
Electronic Imaging 2018
We are pleased to announce that we will return to the IS&T Electronic Imaging conference in 2018, to take place […]
Cologne, Germany Training Course
Imatest representatives will visit Cologne, Germany September 23-25, 2018 to offer a free Information Seminar and paid 2-day Training Course to professionals using or considering Imatest software to improve their image quality testing processes.
Using Arbitrary Charts for Development of the P1858 Variation Combo Chart
The release of Imatest 5.0 introduced a number of powerful new features, including the Arbitrary Charts module which enables Imatest […]
Using Arbitrary Charts Video Series
This series of short videos provides an introduction to the Arbitrary Charts module. Learn how to develop Chart Definition Files. […]
Five reasons to use Imatest 5.0
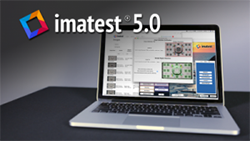
This week, we launched Imatest 5.0. We built Imatest 5.0 to provide users with a streamlined workflow for more efficient […]
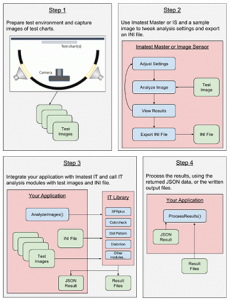
Imatest IS Discontinued with Image Acquisition now Available in Imatest Master
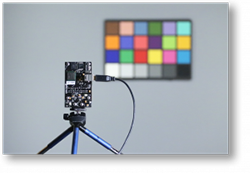
As of Imatest 5.0, Imatest Master now features image acquisition capabilities. Previously, image acquisition capabilities were supported by Imatest IS, […]
Greetings From the Path of Totality
If you were lucky enough to travel to the path of totality on Monday, August 21st, you know firsthand how […]
Shooting the Great American Total Solar Eclipse
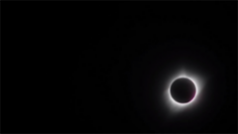
As predicted by astronomers years in advance, a peculiar cosmic event will occur on the morning of August 21st. Passing […]
Using the DarkWorld chart mask
This post is meant to help with the correct setup and operation of the new DarkWorld Chart Mask The DarkWorld […]
Imatest featured as one of three companies changing the autonomous driving landscape
Imatest was recently featured in Automoblog.net’s article, Three Companies Changing the Autonomous Driving Landscape. Carl Anthony writes: “With driverless cars, […]
Imatest Stops Working – Advanced Troubleshooting
Recovering Mathworks Log Files Please recover this log file and send to [email protected] The log file name is called “mathworks_<username>.log”. […]
New Documentation Available for Imatest IT
Imatest is pleased to unveil updated documentation for Imatest IT. The documentation has been updated to include the latest software […]
Challenges in Automotive Image Quality Testing

Imatest’s Norman Koren presents his vision for challenges in automotive image quality testing including resolving low-contrast scenarios.
Closing the Loop: Distortion Correction
Imatest’s charts and software allow you to measure the characteristics and parameters of imaging systems. Quite often these measurements simply […]
Reading an Imatest Plot Episode 2: Noise and Dynamic Range
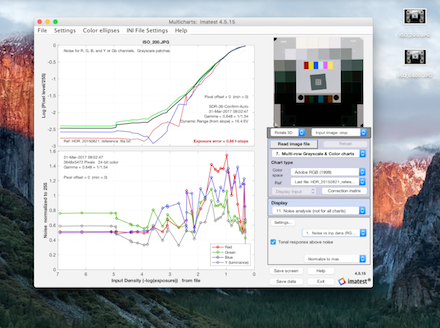
In this video, we dive into how to read Imatest plots for noise and dynamic range.
Handling an Lightroom for iPhone RAW DNG file
Adobe DNG converter for windows & mac can be used to re-save iPhone RAW files into supported DNG formats using the following […]
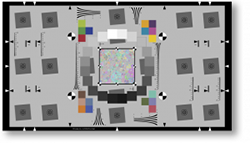
Reading an Imatest Plot: Tonal Response, White Balance, and Gamma
Learn how to use an eSFR-ISO chart in the interactive Rescharts module in Imatest to measure tonal response, gamma, and white balance of a camera.