Year: 2018
Electronic Imaging Symposium 2019

Join Imatest at the Electronic Imaging Symposium from Jan. 13 – 17 in Burlingame, California USA. Explore the entire imaging […]
New 2019 Imatest Licensing – Update Required to Activate
We are migrating to a better, faster licensing platform for our software on January 1, 2019. You may need to […]
December 2018 Reading List

Our team has outlined a list of our favorite imaging resources that we use on the job here at Imatest. […]
Flare: ISO-18844 in the Visible and NIR
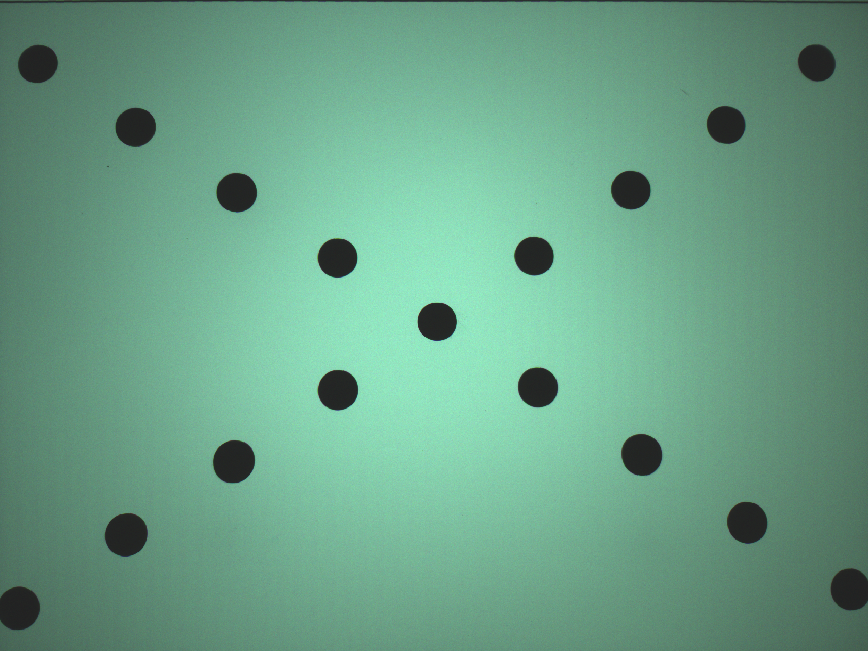
Last month, we posted Considerations when evaluating a Near Infrared camera. We reviewed important considerations for a NIR camera test […]
5 Common Pitfalls in Image Quality Testing
Having trouble with your Imatest test results? This article explains the five most common pitfalls in image quality testing, and […]
Beijing, China Imatest Training Course – November 13-14, 2019
Imatest representatives will visit Beijing November 12-14, 2019 to offer a free information seminar and a paid two-day training course to professionals using or considering Imatest software to improve their image quality testing processes.
San Jose, CA Imatest Training Course – April 2019
Imatest representatives will visit San Jose, CA, April 22-23, 2019, to offer a paid two-day training course to professionals using or considering Imatest software to improve their image quality testing processes.
Seoul, Korea Imatest Training Course and Seminars – April 2019
Imatest representatives will visit Seoul, Korea April 18-19, 2019 to offer free information seminar and a paid two-day training course to professionals using or considering Imatest software to improve their image quality testing processes.
Boulder, Colorado Imatest Training Course – May 2019
Imatest representatives will host a paid two-day training course in Boulder, Colorado on May 8-9, 2019 for professionals using or considering Imatest software to improve their image quality testing processes.
Considerations when evaluating a Near Infrared camera
Recent growth in the automotive and security industries has increased the number of cameras designed for viewing both Near Infrared […]
Increasing the Repeatability of Your Sharpness Tests
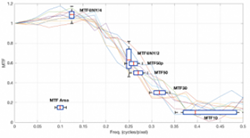
By Robert Sumner With contributions from Ranga Burada, Henry Koren, Brienna Rogers and Norman Koren Consistency is a fundamental aspect of […]
Correcting nonuniformity in slanted-edge MTF measurements
Slanted-edge regions can often have non-uniformity across them. This could be caused by uneven illumination, lens falloff, and photoresponse nonuniformity […]
A customizable image quality solution for Security camera testing
We now offer a complete, customizable image quality testing solution for security camera systems to provide our customers with an […]
San Jose, CA Training Course
Imatest representatives will visit San Jose August 5th and 6th to offer a paid two-day Training Course to professionals using or considering Imatest software to improve their image quality testing processes.
San Jose, CA Training Course
Imatest representatives will visit San Jose August 2nd and 3rd to offer a free information seminar and paid 2-day Training Course to professionals using or considering Imatest software to improve their image quality testing processes.
Introducing Imatest 5.1
Our engineers are continually adding new features and updating Imatest software to provide you with the best analysis tool on […]
Why is it Important to Test in Low-Light?
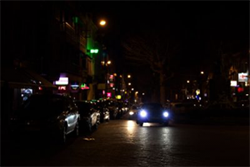
It is important to test your camera system in environments which reproduce lighting conditions similar to where you intend […]
Imatest does not start, unable to read MAT-file
If upon opening Imatest you get something like this: Error: Error using load Unable to read MAT-file C:\ProgramData\Imatest\mcr_cache\5.0\Master\mcrCache9.2\imates0\.matlab\matlabprefs.mat. File […]
Undefined variable “py” or class “py.model.Message”.
With the addition of python routines in Imatest 5.0, several components require a working python installation. When some installation problems […]
How to Test Dynamic Range: A step-by-step use case with the Pixel 2 XL
In this post, we will be using the Contrast Resolution Chart and Imatest Master to measure the dynamic range of […]