images
Price range: $440.00 through $600.00
Please Note
This chart does not conform to the updated ISO 12233:2014 standard. We recommend the Photographic ISO 12233:2014 E-SFR chart for testing that does not specifically require the old chart.
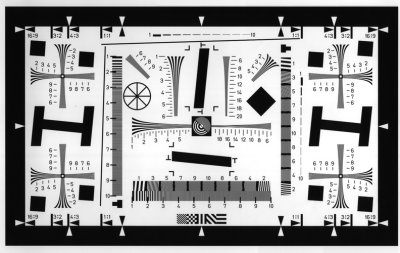
The ISO Camera Resolution Chart conforms to the ISO-12233:2000 standard, “Photography-Electronic still picture cameras – Resolution measurements”. Hyperbolic wedges for resolution evaluation range from 100 – 2000 lines per picture height. Other features include checker patterns, multiple slant-edge lines, a center-focus zone plate and framing marks for 1:1, 4:3, 3:2, and 16:9 aspect ratios.
Description
- Active Area: Charts are available in two sizes. It is recommended that the smaller charts be used to test imaging systems with sensors up to 8mp, and the larger charts be used for testing of sensors above 8mp.
- The smaller chart has an active area of approximately 533.4mm x 863.6mm (21″ x 34″) and is printed on 571.5mm x 952.5mm (22.5″ x 37.5″) paper.
- The larger chart has an active area of approximately 850.9mm x 1397mm (33.5″ x 55″) and is printed on 1038.22mm x 1428.75mm (40.87″ x 56.25″) paper.
- Paper/ink type: Semi-gloss OR Matte. Matte paper/ink can be used to reduce reflected light, but is slightly less sharp than semi-gloss paper. Semi-gloss paper/ink is recommended for most applications.
Notes: This chart is used to measure sharpness from slanted-edge patterns (as Spatial Frequency Response = SFR) using the Imatest SFR module. It can also measure resolution from the hyperbolic wedges using the Imatest Wedge module (a part of Rescharts).
You may also like…
-
ISO 12233 Test Charts on Color High-Precision LVT Film
$600.00 Select options This product has multiple variants. The options may be chosen on the product page -
ISO 12233:2017 Edge SFR (eSFR) Photographic chart
Price range: $1,260.00 through $2,030.00 Select options This product has multiple variants. The options may be chosen on the product page