Imatest SFRreg performs highly automated measurements of sharpness (expressed as Spatial Frequency Response (SFR), also known as Modulation Transfer Function (MTF)) and Lateral Chromatic Aberration from images that contain registration mark patterns (circles with two light and two dark quadrants). Unlike standard test charts, these patterns do not need to be located on a flat (planar) surface. Depending on the image source, they offer two advantages. You can
|
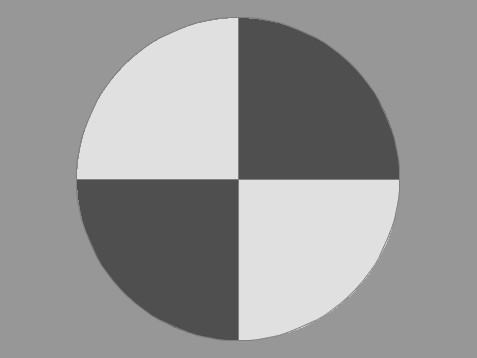 Registration mark Registration mark |
Details of the regions to be analyzed are based on user-entered criteria (similar to SFRplus or eSFR ISO, which it closely resembles).
Sharpness is derived from light/dark slanted edges inside the registration marks, as described in Sharpness: What is it and how is it measured? SFRreg can handle a wide range of camera aspect ratios and chart arrangements.
SFRreg operates in two modes.
- Interactive/setup mode allows you to select settings and interactively examine results in detail. Saved settings are used for Auto Mode.
- Auto mode runs automatically with no additional user input. ROIs are located automatically based on settings saved from the interactive/setup mode. This allows images of different sizes and framing to be analyzed with no change of settings. Auto mode works with large batches of files, and is especially useful for automated testing, where framing may vary from image to image.
Part 1 of the instructions introduces SFRreg and explains how to obtain and photograph the chart. Part 2 shows how to run SFRreg inside Rescharts and how to save settings for automated runs. Part 3 illustrates the results.
SFRreg images from the Optikos Meridian projection systemImatest SFRreg is originally designed designed to work with images from the Optikos Meridian system, which consists of several projectors that project registration mark patterns towards a camera. These patterns appear at infinity focus at the camera. A typical image is shown below. |
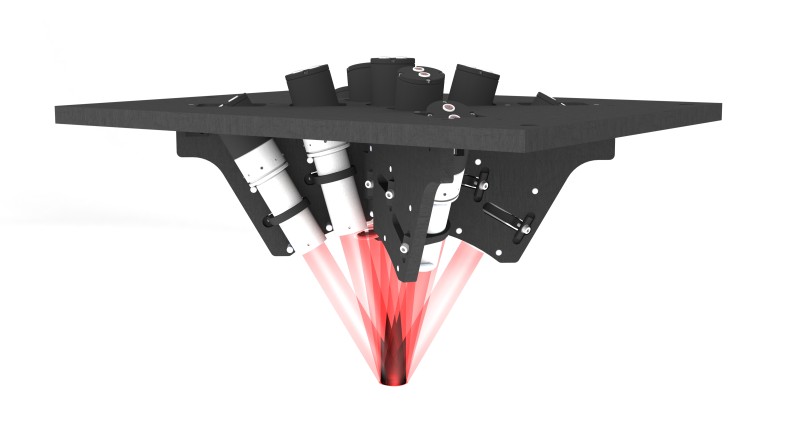 |
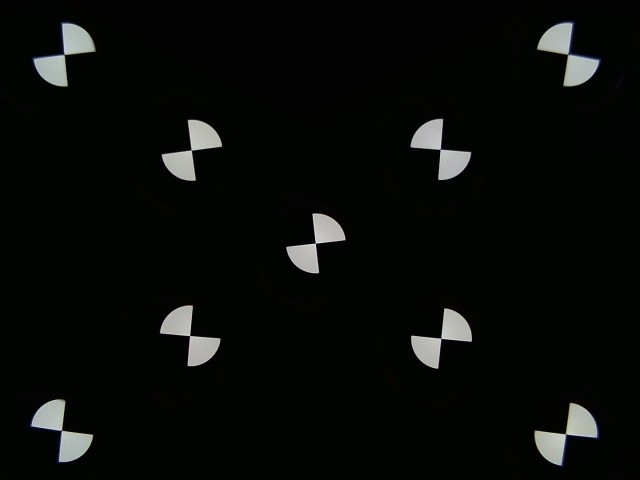 Image acquired from a 9-projector Optikos Meridian system
SFRreg images from arbitrary arrays of printed registration mark charts
SFRreg also works with printed registration mark patterns, which can be placed anywhere in the image. For extreme wide-angle (fisheye) lenses they should be oriented facing directly towards the camera. Here is a synthesized image (we’ll add a real one soon). You can add other charts— typically color or grayscale— to the image for additional measurements.
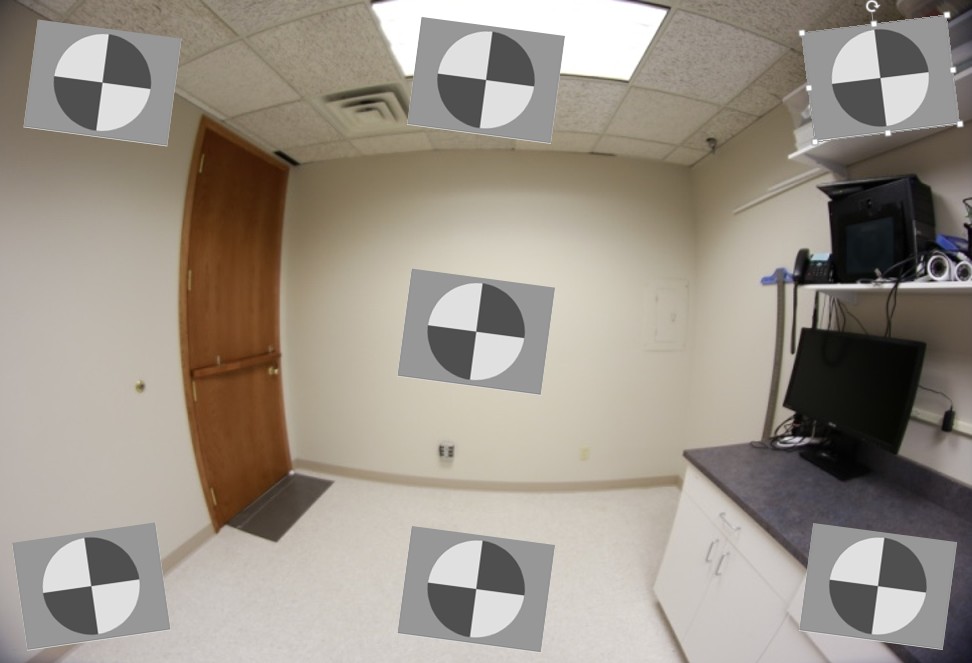 Fisheye lens image with synthesized registration mark charts oriented facing the camera
| Options | Notes | |
|---|---|---|
| Media | Inkjet (reflective), LVT film (transmissive) |
Inkjet (reflective) is usually the most practical choice. |
| Contrast |
4:1, 10:1 |
4:1 contrast is specified in the new ISO 12233:2014 standard. |
| Surface | Matte or semigloss | Semigloss is slightly sharper, but is more susceptible to glare (specular reflections), especially with wide angle lenses. Matte surface is recommended for wide angle lenses or difficult lighting situations. |
| Slanted-edge algorithm The algorithms for calculating MTF/SFR were adapted from a Matlab program, sfrmat, written by Peter Burns ( |
Obtaining and photographing the charts
Registration Mark charts can be purchased from the Imatest store in a variety of inkjet media (reflective and transmissive) (Other media will be available on request.) Although we recommend that you purchase the charts, they can be printed on photographic-quality inkjet printers, but you must have fine materials, skill, and a knowledge of color management.
SFRreg results
When calculations are complete, results are displayed in the Rescharts window, which allows a number of displays to be selected. The following table shows where specific results are displayed. Results plots are very similar to SFRplus and eSFR ISO. We show two samples of results below.
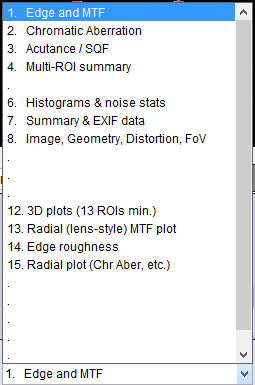 SFRreg display selections
| Measurement | Display |
| MTF (sharpness) for individual regions | 1. Edge and MTF |
| MTF (sharpness) for entire image | 4. Multi-ROI summary 12. 3D plot 13. Lens-style MTF plot |
| Lateral Chromatic Aberration | 2. Chromatic Aberration |
| Original image showing region selection | 8. Image & geometry |
| EXIF data | 7. Summary & EXIF data |
| Acutance/SQF (Subjective Quality Factor) | 3. SQF / Acutance |
| Edge roughness | 14. Edge roughness |
| Chromatic Aberration (radial) | 15. Radial (Chr Aber, etc.) |
Multi-ROI summary display
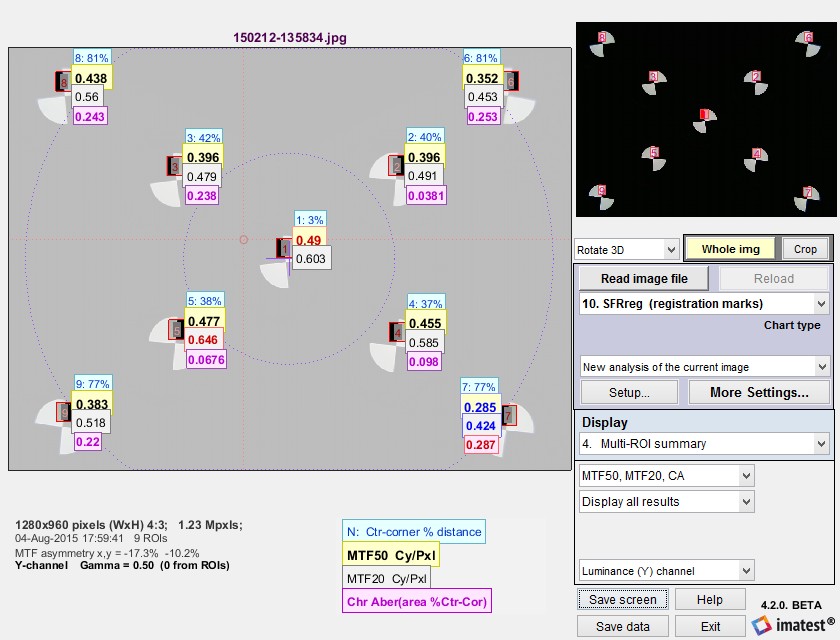 SFRreg results in Rescharts window: Multiple region (ROI) summary
(Only upper Vertical regions have been selected to keep the view uncluttered.)
The multi-ROI (multiple Region of Interest) summary shown in the Rescharts window (above) contains a detailed summary of SFRreg results. (3D plots also contain an excellent summary.) The upper left contains the image in muted gray tones, with the selected regions surrounded by red rectangles and displayed with full contrast. Up to four results boxes are displayed next to each region. The results are selected the the Display options area on the right of the window, below the Display selection.
|
The Results selection (right) lets you choose which results to display. N is region number. Ctr-corner distance % is the approximate location of the region. CA is Chromatic Aberration in area, as percentage of the center-to-corner distance (a perceptual measurement). A legend below the image shows which results are displayed. The View selection (far right) lets you select how many results boxes to display, which can be helpful when many regions overlap. From top to bottom the number of boxes is 4, 3, 2, 2, and 1, respectively. |
 Results selection |
 View selection View selection |
Edge and MTF display
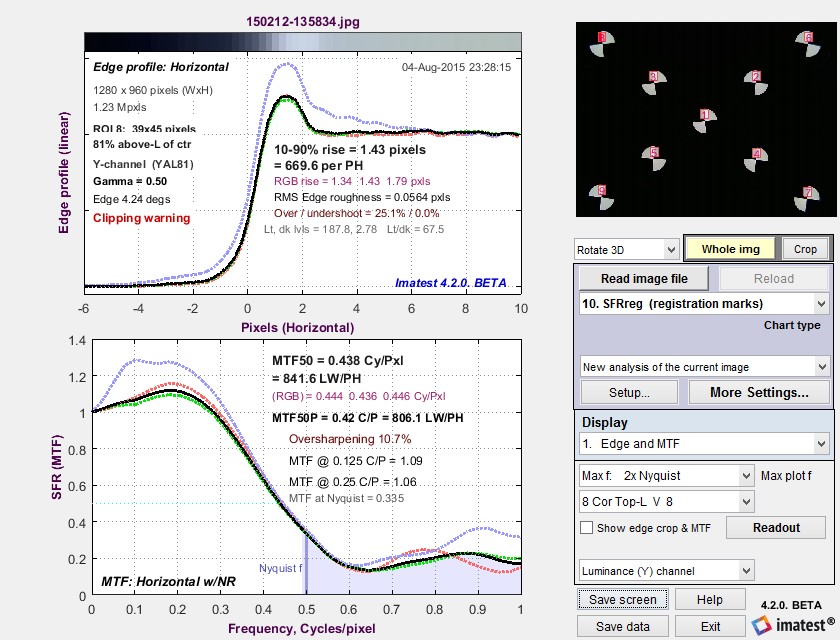 Edge and MTF display in Rescharts window
Diffraction-limited MTF and edge response are shown as a pale brown dotted lines
when pixel spacing (5.7um for the EOS-40D) has been entered.
This display is identical to the SFR Edge and MTF display. The edge (or line spread function) is plotted on the top and the MTF is plotted on the bottom. The edge may be displayed linearized and normalized (the default; shown), unlinearized (pixel level) and normalized, or linearized and unnormalized (good for checking for saturation, especially in images with poor white balance). Edge display is selected by pressing .
There are a number of readouts, including 10-90% rise distance, MTF50, MTF50P (the spatial frequency where MTF is 50% of the peak value, differing from MTF50 only for oversharpened pulses), the secondary readouts (MTF @ 0.125 and 0.25 C/P in this case), and the MTF at the Nyquist frequency (0.5 cycles/pixel). The diffraction-limited MTF curve (not shown above) is displayed as a pale brown dotted line when pixel pitch is entered.
MTF is explained in Sharpness: What is it and how is it measured? MTF curves and Image appearance contains several examples illustrating the correlation between MTF curves and perceived sharpness.
How to Read MTF Curves by H. H. Nasse of Carl Zeiss. Excellent, thorough introduction. 33 pages long; requires patience. Has a lot of detail on the MTF curves similar to the Lens-style MTF curve in SFRplus. Even more detail in Part II. Their (optical) MTF Tester K8 is of some interest.
Understanding MTF from Luminous Landscape.com has a much shorter introduction.
Understanding image sharpness and MTF A multi-part series by the author of Imatest, mostly written prior to Imatest’s founding. Moderately technical.
Bob Atkins has an excellent introduction to MTF and SQF. SQF (subjective quality factor) is a measure of perceived print sharpness that incorporates the contrast sensitivity function (CSF) of the human eye. It will be added to Imatest Master in late October 2006.
Optikos makes instruments for measuring lens MTF. Their site has some interesting articles, for example, Lens Testing: The Measurement of MTF (Modulation Transfer Function).