Chart Quality Calculator

Imatest lets you use the measured test chart modulation transfer function (MTF) to Determine the suitability of a test chart, which is characterized by size (height), print media, and printing technology, for camera MTF measurements where the camera is characterized by the number of vertical pixels. This can help determine whether a test chart is appropriate for a specific application.  Increase the accuracy of MTF measurements by dividing the measured camera MTF by the chart MTF projected on the image sensor. This is equivalent to deconvolution in spatial domain. This technique is described in Compensating camera MTF measurements for chart and […]

Batchview

Postprocessor for viewing summaries of SFR, SFRplus, Checkerboard, and eSFR ISO results Introduction to Batchview Batchview is a postprocessor for displaying lens test results generated by SFR, SFRplus, and eSFR ISO batch runs (analyses of groups of test chart images taken at various apertures, focal lengths, etc.). It can store and display up to four sets of results for convenient comparisons in Imatest Master; two in Studio. Postprocessor comparison Each lets you compare sharpness of different regions and/or images MTF Compare Postprocessor to SFR, SFRplus, and eSFR ISO. Input is two CSV results files for individual regions. Lets you compare individual […]

Autofocus Speed

Imatest 4.4+ can evaluate auto-focus (AF) as a measure of MTF with respect to time. This can be performed by using the SFR module with an appropriate video file. Related pages Auto Exposure in Stepchart Autofocus Speed in SFR Auto White balance in Colorcheck Uses/Purpose This metric is intended to be used as a way to measure the time a camera system takes to auto-focus. Rise time and settling time are automatically calculated. This measurement does not provide information about the accuracy or precision of auto-focus. To evaluate those measures, several measurements should be performed on the final, settled images and compared. File […]

Arbitrary Charts Module Settings

Analyses & Output – INI settings – Chart Definition Files – Chart Definition Utility – Video Analysis   INI file fields relevant to Arbitrary Charts The following INI fields are currently exposed to the user to control the behavior of the Arbitrary Charts module and its output. They have been organized here by topic, but do not need to be in any particular order or grouping in your INI file itself.    [arbcharts] section Slanted-edge Analysis     Texture Analysis   Star Analysis   Wedge Analysis   Uniformity Grid Analysis   Color/Tone/Noise   Circle Detection   Perceptual metrics   Video Analysis   […]

Arbitrary Charts

Analyses & Output – INI settings – Chart Definition Files – Chart Definition Utility – Video Analysis   Combine all the features you need to analyze into a single chart Introduction The Imatest™ Arbitrary Charts module analyzes images of custom test charts. A chart-definition file (typically user defined) is needed to describe the chart layout to Imatest software. The Arbitrary Charts module will automatically locate and analyze target features when an observed image of a chart is loaded along with the corresponding definition file.    This module allows users to get a number of measurements out of custom, legacy, or competitors’ charts which […]

Acutance and SQF (Subjective Quality Factor)

Introduction to Acutance and SQF   Acutance and Subjective Quality Factor (SQF) are measures of perceived print or display sharpness. SQF was used for years in the photographic industry but has remained unfamiliar to most photographers. Acutance is a relatively new measurement from the IEEE Camera Phone Image Quality (CPIQ) group. Both are metrics which incorporate the effects of The imaging system: The Modulation Transfer Function (MTF) of the camera as a measurement of its intrinsic sharpness. The viewer: The human eye’s sensitivity to each spatial frequency modeled with a Contrast Sensitivity Function (CSF). The viewing conditions: The image display height […]

Glossary

Spanish language translation: Glosario en Espanol Aliasing   Low frequency artifacts, sometimes quite disturbing, that appear when the image sensor receives significant signal energy above the Nyquist frequency. Color aliasing in Bayer sensors can be particularly troublesome. “Moire fringing” is a type of aliasing. See diagram in Nyquist frequency, below. Controlled by means of Anti-Aliasing (Optical Lowpass) Filters, which blur the image slightly (a classic tradeoff).  Aperture   The circular opening at the center of a lens that admits light. Generally specified by the f-stop (f-number), which is the focal length divided by the aperture diameter. A large aperture corresponds […]

Documentation – Current v24.1

View Release Notes   For beginners: We recommend these web pages for getting started: Introduction to the new Imatest Main Window (New in 2021.2) Image Quality Factors – Using Imatest – Getting started – Imatest Updates and Features  VIDEOS – Online training – Consulting – News    Index of the Table of Contents Offline documentation Download the website for offline view (with a web browser) Image Quality  IQ factors (KPIs) measured by Imatest, with links to detailed descriptions and instructions. Sharpness  Introductions to sharpness and sharpening; comparisons of different charts; chart quality limitations & how to overcome them Other IQ […]

Chromatic Aberration AKA Color fringing

Introduction  |  Measurement  |  Modules  |  Demosaicing Purple fringing – CA correction for non-tangential edges Introduction Chromatic aberration (CA) is one of several aberrations that degrade lens performance. (Others include coma, astigmatism, spherical aberration, and curvature of field.) It occurs because the index of refraction of glass varies with the wavelength of light, i.e., glass bends different colors by different amounts. This phenomenon is called dispersion. It appears as color fringing, most visibly on tangential edges near the boundaries of the image. It is sometimes confused with another effect, which we call pixel shift— a color channel offset that is […]

Checkerboard instructions, Part 1

Obtain and photograph chart –  Lighting – Distance – Exposure – Tips – Links Imatest Checkerboard performs highly automated measurements of sharpness (expressed as Spatial Frequency Response (SFR), Lateral Chromatic Aberration, and optical distortion from images of checkerboard patterns (with a recommended tilt angle of ~5-8 degrees for sharpness measurements). The primary advantages of Checkerboard are: Compared to Imatest’s other automatically-detected sharpness modules:  It is relatively insensitive to framing. You can zoom in or out as much as you like, as long as there are detectable corner features.  Compared to the Distortion (legacy) module:  It works with highly-distorted (fisheye lens) images. Calculations are more accurate, and it contains all results […]

Checkerboard INI file reference

For more information on how to use INI files in Imatest IT, we recommend the Imatest INI File Reference This document was created by running checkerboard in Imatest 5.2.0. ALPHA on 30-May-2019 22:57:20. For Imatest IT, most of these entries don’t need to be entered. Many don’t affect Imatest IT results: they control interactive figure displays or figure output formats (figures are often not used in Imatest IT). Background Meaning Yellow Yellow background: Important to Imatest IT. Parameter and Description are in boldface. [IT] Cyan Cyan background: Figure settings. (Figures are used infrequently for IT.) [f] Gray Gray background: For […]

Chart Quality Index (CQI) (deprecated)

Imatest 5.1 has important new capabilities for measuring and correcting MTF degradation caused by test charts. These new capabilities are far easier to understand and apply than CQI. Chart quality calculator Compensating camera MTF measurements for chart and sensor MTF As a result of the improved measurements, the Chart Quality Index measurement has been deprecated. The Chart Finder is an interactive web page that can help you select the appropriate chart size and media. It contains results from this page, but without the math. Summary In order to determine the suitability of a test chart is for measuring the performance of a […]

Chart Quality Calculator

Imatest lets you use the measured test chart modulation transfer function (MTF) to Determine the suitability of a test chart, which is characterized by size (height), print media, and printing technology, for camera MTF measurements where the camera is characterized by the number of vertical pixels. This can help determine whether a test chart is appropriate for a specific application.  Increase the accuracy of MTF measurements by dividing the measured camera MTF by the chart MTF projected on the image sensor. This is equivalent to deconvolution in spatial domain. This technique is described in Compensating camera MTF measurements for chart and […]

Batchview

Postprocessor for viewing summaries of SFR, SFRplus, Checkerboard, and eSFR ISO results Introduction to Batchview Batchview is a postprocessor for displaying lens test results generated by SFR, SFRplus, and eSFR ISO batch runs (analyses of groups of test chart images taken at various apertures, focal lengths, etc.). It can store and display up to four sets of results for convenient comparisons in Imatest Master; two in Studio. Postprocessor comparison Each lets you compare sharpness of different regions and/or images MTF Compare Postprocessor to SFR, SFRplus, and eSFR ISO. Input is two CSV results files for individual regions. Lets you compare individual […]

Autofocus Speed

Imatest 4.4+ can evaluate auto-focus (AF) as a measure of MTF with respect to time. This can be performed by using the SFR module with an appropriate video file. Related pages Auto Exposure in Stepchart Autofocus Speed in SFR Auto White balance in Colorcheck Uses/Purpose This metric is intended to be used as a way to measure the time a camera system takes to auto-focus. Rise time and settling time are automatically calculated. This measurement does not provide information about the accuracy or precision of auto-focus. To evaluate those measures, several measurements should be performed on the final, settled images and compared. File […]

Arbitrary Charts Module Settings

Analyses & Output – INI settings – Chart Definition Files – Chart Definition Utility – Video Analysis   INI file fields relevant to Arbitrary Charts The following INI fields are currently exposed to the user to control the behavior of the Arbitrary Charts module and its output. They have been organized here by topic, but do not need to be in any particular order or grouping in your INI file itself.    [arbcharts] section Slanted-edge Analysis     Texture Analysis   Star Analysis   Wedge Analysis   Uniformity Grid Analysis   Color/Tone/Noise   Circle Detection   Perceptual metrics   Video Analysis   […]

Arbitrary Charts

Analyses & Output – INI settings – Chart Definition Files – Chart Definition Utility – Video Analysis   Combine all the features you need to analyze into a single chart Introduction The Imatest™ Arbitrary Charts module analyzes images of custom test charts. A chart-definition file (typically user defined) is needed to describe the chart layout to Imatest software. The Arbitrary Charts module will automatically locate and analyze target features when an observed image of a chart is loaded along with the corresponding definition file.    This module allows users to get a number of measurements out of custom, legacy, or competitors’ charts which […]

Acutance and SQF (Subjective Quality Factor)

Introduction to Acutance and SQF   Acutance and Subjective Quality Factor (SQF) are measures of perceived print or display sharpness. SQF was used for years in the photographic industry but has remained unfamiliar to most photographers. Acutance is a relatively new measurement from the IEEE Camera Phone Image Quality (CPIQ) group. Both are metrics which incorporate the effects of The imaging system: The Modulation Transfer Function (MTF) of the camera as a measurement of its intrinsic sharpness. The viewer: The human eye’s sensitivity to each spatial frequency modeled with a Contrast Sensitivity Function (CSF). The viewing conditions: The image display height […]

Image Information Metrics: Information Capacity and more

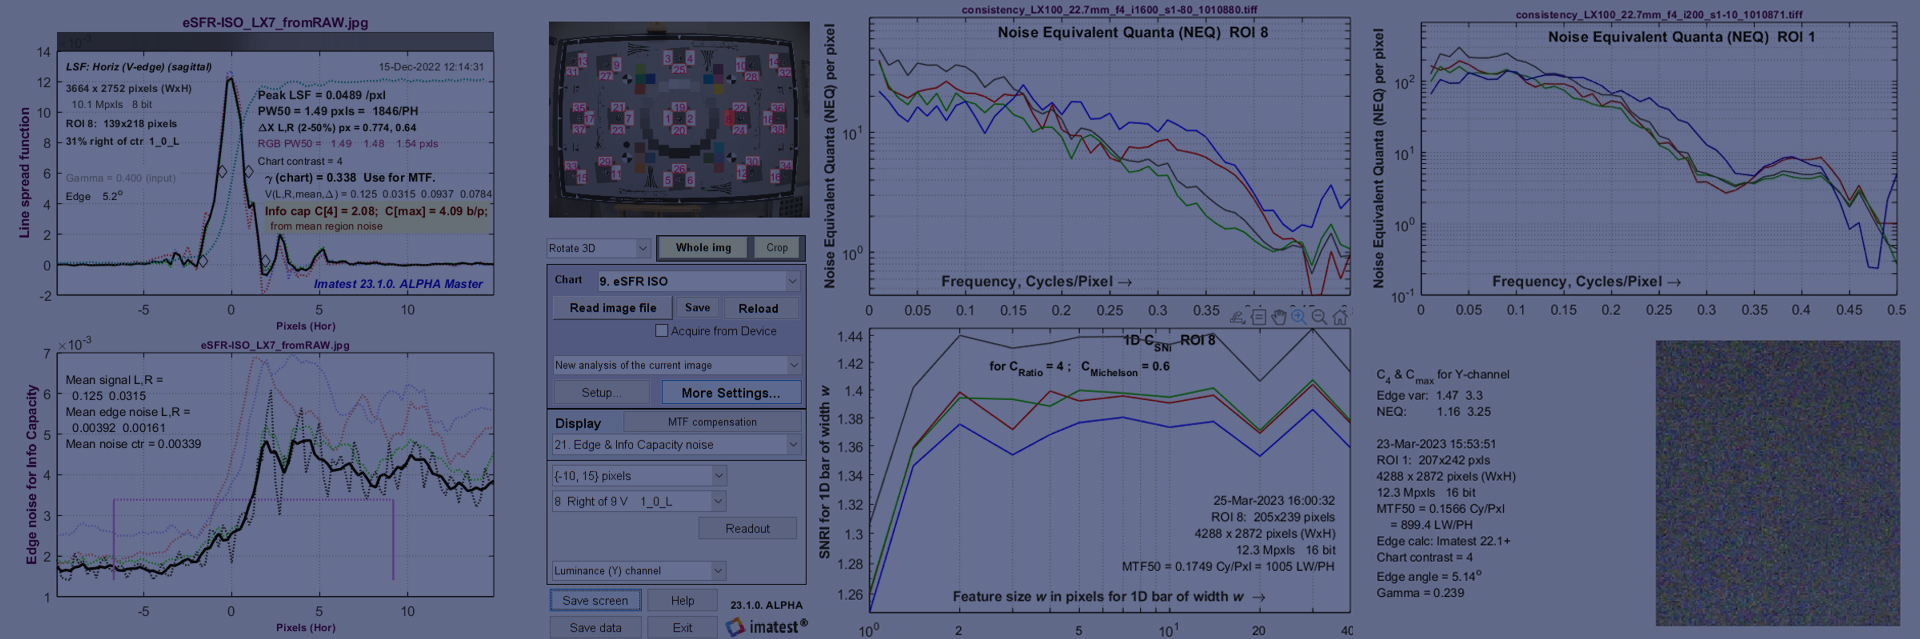
Introduction – Video – Documentation – White papers – Documentation web pages – Electronic Imaging 2024 paper – ISO 23654 – Call for participation Introduction The market for cameras that produce images for Machine vision (MV) and Artificial Intelligence (AI), in contrast to pictorial images for human vision, is steadily growing. Applications include automotive (driver assistance and autonomous vehicles), robotics, security, and medical imaging systems. Two questions arise when designing camera systems for such applications. How best to select (or qualify) cameras for MV/AI applications? What image processing (ISP or filtering) is optimal? To answer these questions, we must go beyond standard measurements […]

Test Lab Services

Providing third-party objective image quality testing to meet your needs. As experts in the field of image quality testing, leave the IQ lab work to us. We know that each test lab setup is unique to the needs of your company—contact us today and one of our engineers will get in touch with you about your project. Imatest can cater your test lab service goals: We help create a customized service that achieves the testing objectives of your organization while working within your budget. Trained consultants will spend time with your team to better understand your needs and create a […]