Search Results for: MTF
Documentation – Previous v22.2
View Release Notes For beginners: We recommend these web pages for getting started: Introduction to the new Imatest Main Window (New in 2021.2) Image Quality Factors – Using Imatest – Getting started – Imatest Updates and Features VIDEOS – Online training – Consulting – News Index of the Table of Contents Offline documentation Download the website for offline view (with a web browser) Image Quality IQ factors (KPIs) measured by Imatest, with links to detailed descriptions and instructions. Sharpness Introductions to sharpness and sharpening; comparisons of different charts; chart quality limitations & how to overcome them Other […]
Correlating the Performance of Computer Vision Algorithms with Objective Image Quality Metrics
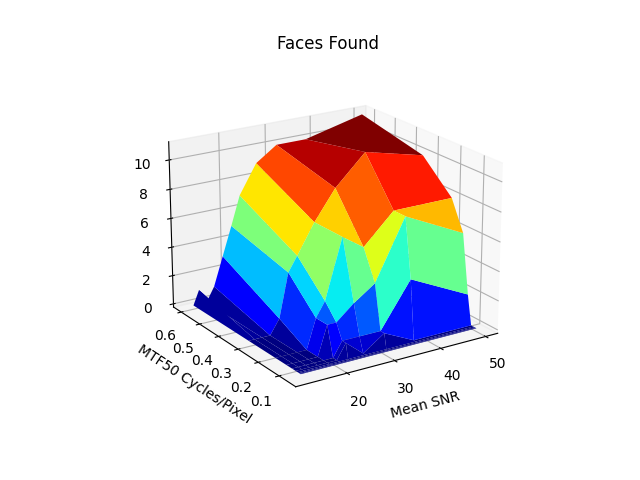
by Henry Koren 1. Why care about the quality of your cameras? The task of computer vision (CV) involves analyzing a stream of images from an imaging device. Some simple applications such as object counting may be less dependent on good camera quality. But for more advanced CV applications where there is limited control of lighting & distance, the quality of your overall vision system will depend on the quality of your camera system. This is increasingly important when an error made by the vision system could lead to a decision that impacts safety. Along with proper optimization of a […]
Imatest Customer Profile – Dr. Brian Deegan

Imatest is happy to introduce customer profiles! Each month, we will interview one of our Imatest users to share why they use the software and create a sense of community among our users. Interested in being featured? Reach out to mia@imatest.com. The first customer profile is Dr. Brian Deegan. Based in Ireland, Brian is a long-time user who has utilized the Imatest software across multiple disciplines. Read more about our interview with Brian: Mia: How long have you been using Imatest? Brian: It must be ten years now at this stage. I started at Valeo in 2011 and […]
Imatest Releases Version 22.1
Imatest Version 22.1 introduces new features including Automatic Chart Identification, Internationalization, ISO 12233 Standards Support, Sagittal/Tangential MTF Plot Updates, and more.
FocusField
Postprocessor for SFRplus, Checkerboard, and eSFR ISO for analyzing image quality factors that require multiple images: Curvature of field, Longitudinal (Axial) Chromatic Aberration, & more Introduction to FocusField FocusField is a postprocessor for displaying camera test results from batches of images acquired at different distances and/or with different focus settings (also with different apertures), then analyzed by SFRplus, Checkerboard, or eSFR ISO batch runs. (These modules are preferred because magnification, and hence distance, can be derived from the image.) It can display Depth of Field (DoF), Curvature of field, Longitudinal (axial) chromatic aberration, and Lens focal length (when used with the motorized […]
Wedge
Analysis of wedge patterns with the Imatest Wedge and eSFR ISO modules News 2021.2 — Logarithmic wedges: a superior design describes the advantages of logarithmic wedges, which have a much better distribution of spatial frequencies than hyperbolic wedges, allowing a larger maximum/minimum frequency ratio. Supported by Imatest (automatically detected) since 2021, but (as of May 2022) not currently included in standard eSFR ISO charts (though available on request). 2020.2 — Calculations were greatly sped up in order to improve performance of direct image acquisition. During the testing of the speedup with direct acquisition, we found that Wedge results were unstable during […]
Version Comparison: Studio vs. Master
Which version is right for you? Imatest 5.0: All functions of Imatest Image Sensor have been incorporated into Imatest Master. Imatest is available in several GUI (Graphic User Interface)-based versions. Studio, with everything individual photographers need to test their cameras and lenses. Studio is only available to individual photographers. Master, the full-featured industrial-strength version for engineers and scientists who develop and evaluate imaging systems. Acquire images directly from several manufacturer’s development systems. Images can be updated and analyzed in real time with the Rescharts, Multicharts, and Uniformity-Interactive modules. As of Imatest 5.0, Image Sensor (IS) has been discontinued. All […]
Validating the Imatest slanted-edge calculation
Introduction Imatest’s slanted-edge algorithms for calculating MTF/SFR are based on ISO 12233 standard, “Photography – Electronic still picture cameras – Resolution measurements”. Although this standard is well-established in industry, we often receive questions regarding its validity. This document describes methods for validating the Imatest slanted-edge method for calculating image sharpness (expressed as Modulation Transfer Function, MTF, which is synonymous in practice with Spatial Frequency Response, SFR). MTF is a measurement of image contrast as a function of spatial frequency. As such, it is a measure of device or system sharpness, which is only indirectly related to perceived image sharpness in […]
Using Test Charts
Create test charts for high quality inkjet printers Although we strongly recommend that customers purchase charts from the Imatest Store, the Imatest Test Charts module allows you to create test chart files for printing on high quality photographic inkjet printers. If you plan to print charts using this module, you should be skilled at fine printing and have a knowledge of color management to obtain optimum chart quality; otherwise we recommend purchasing charts at the Imatest Store. Disclaimer: Although we sell most of the charts generated by the Imatest Test Charts module, several variations are not available because (A) it’s […]
Using Stepchart
Photographing the chart – Running Stepchart – Settings – Output – Temporal noise Auto-exposure – Saving – Dynamic range (DR) – DR definitions – Algorithm Stepchart measures the tonal response, noise, dynamic range, and ISO sensitivity of digital cameras and scanners using Reflective grayscale step charts such as the Kodak Q-13 and Q-14 Gray Scales, which have a single row of patches (a linear arrangement), or charts such as the ISO-14524 or ISO-15739 charts, with non-linear (multiple rows; may be circular) patch arrangements, shown below, or Transmissive (backlit) grayscale step charts such as the Imatest 36-patch Dynamic Range or 36-patch […]
Using SFRreg, Part 3: Results
Imatest SFRreg performs highly automated measurements of sharpness (expressed as Spatial Frequency Response (SFR), also known as Modulation Transfer Function (MTF)) and Lateral Chromatic Aberration from images that contain registration mark patterns (circles that contain two light and two dark quadrants). This document illustrates SFRreg results. Part 1 introduced SFRreg and explained how to obtain and photograph the chart. Part 2 showed how to run SFRreg inside Rescharts and how to save settings for automated runs. SFRreg results When calculations are complete, results are displayed in the Rescharts window, which allows a number of displays to be selected. The following […]
Using SFRreg, Part 2: Running SFRreg
Running SFRreg (Interactive and Auto mode settings) Setup window – ROI numbering – More settings – SFRreg target detection Auto mode settings – Warnings – Summary Imatest SFRreg performs highly automated measurements of sharpness (expressed as Spatial Frequency Response (SFR), also known as Modulation Transfer Function (MTF)) and Lateral Chromatic Aberration from images that contain registration mark patterns (circles that contain two light and two dark quadrants). This document shows how to run SFRreg in Rescharts and how to save settings for automated runs. Part 1 introduced SFRreg and explained how to obtain and photograph the chart. Part 3 illustrates the […]
Using SFRreg Part I
Imatest SFRreg performs highly automated measurements of sharpness (expressed as Spatial Frequency Response (SFR), also known as Modulation Transfer Function (MTF)) and Lateral Chromatic Aberration from images that contain registration mark patterns (circles with two light and two dark quadrants). Unlike standard test charts, these patterns do not need to be located on a flat (planar) surface. Since Region of Interest (ROI) detection is automatic, they may be positioned where needed. Depending on the image source, they offer several advantages. You can Test images at infinity distance (or any distance of choice) using a compact projection system such as a collimator […]
Using SFRplus Part 2
Running SFRplus (Interactive and Auto mode settings) Imatest SFRplus performs highly automated measurements of several key image quality factors using a specially-designed test chart. This document shows how to run SFRplus in Rescharts and how to save settings for automated runs. Part 1 introduced SFRplus and explained how to obtain and photograph the chart. Part 3 illustrates the results. New in Imatest 3.10 SFRplus settings can be updated by clicking Settings, SFRplus Auto settings in the Imatest main window without having to read an image file into Rescharts SFRplus Setup. New in Imatest 3.9 SFRplus can be run without including […]
Using SFRplus, Part 3: Results
Imatest SFRplus results Imatest SFRplus performs highly automated measurements of several key image quality factors using the specially-designed SFRplus test chart. Unlike most other modules, the user never has to manually select Regions of Interest (ROIs). Image quality factors include Sharpness, expressed as Spatial Frequency Response (SFR), also known as the Modulation Transfer Function (MTF), Noise, Lateral Chromatic Aberration, Distortion (with nearly as detailed output as the Distortion module). Described in detail here. Tonal response (again, with less detail than Stepchart; no noise statistics) Color accuracy, when used with an SFRplus that contains the optional color pattern, located above the […]
Using SFRplus Part 1
The SFRplus chart: description and how to photograph it Slanted-edge test – Advantages – Obtain chart – Framing – No bars – Lighting Distance – Exposure – Tips – Links Watch on YouTube. Download 1080p/720p/540p. Purchase SFRplus Test Charts from the Imatest Store. Imatest SFRplus performs highly automated measurements of several key image quality factors using a specially-designed test chart that may be purchased from the Imatest store (recommended) or printed on a high-quality inkjet printer. The user does not need to manually select Regions of Interest (ROIs). Image quality factors include Sharpness, expressed as Spatial Frequency Response (SFR), also known as Modulation Transfer Function (MTF), which can be mapped over the entire image, Noise (limited: […]
Using SFR part 2: Running Imatest SFR
From the Imatest main window, click on SFR or Rescharts on the upper left. SFR allows you to analyze multiple regions and to run batches of files. Rescharts (1. Slanted-edge SFR) allows you to analyze single regions in a highly-interactive interface. ISO 12233:2000 chart images, which have contrasty (≥40:1) slanted-edges, can be downloaded from dpreview.com reviews, typically in the last page titled “Compared to…,” and from Imaging-resource.com reviews, typically on the page labeled “sample images.” We no longer recommend such high contrast images, because saturation can lead to inaccurate results. 4:1 or 10:1 contrast images are much preferred. Image file […]
Using Screen Patterns
Monitor patterns for Light Falloff, SFR, Distortion, and monitor calibration Introduction Screen Patterns displays a variety of test patterns on monitors, preferably on LCD flat screen monitors. It may become more useful as cost-effective ultra-high resolution (4k+) monitors become available. It is opened by clicking on Screen Patterns on the right of the Imatest main window. Most patterns (except perhaps Monitor calibration) perform best with the window maximized. You may need to redraw the pattern after maximizing (or resizing) it by selecting the pattern or changing one of the settings. These patterns are offered as a convenient alternative to the […]
Using SFR Part 1
Setting up and photographing SFR test charts Imatest SFR measures spatial frequency response, also known as the Modulation Transfer Function (MTF), of digital cameras using a slanted-edge (light-to-dark) target, as described in Sharpness: What is it and how is it measured? Although it doesn’t provide the as strong a visual indication of MTF as wedge or sinusoidal chats (such as Log Frequency), it provides a more accurate quantitative measurement and uses space much more efficiently. Old ISO 12233:2000 test chart (left) with Imatest SFR cropping indicated by the red rectangle New ISO 12233:2014 test chart (right– supported with a high […]
Using Rescharts slanted-edge modules Part 2
Running Rescharts slanted-edge modules (Interactive and Auto mode settings) Imatest Rescharts slanted edge modules— SFRplus, eSFR ISO, SFRreg, and Checkerboard— perform highly automated measurements of several key image quality factors using specially-designed test charts. This document shows how to run these modules in Rescharts and how to save settings for automated runs. Four introductory pages — SFRplus, eSFR ISO, SFRreg, and Checkerboard — describe each module and explain how to obtain and photograph the chart. Rescharts Results Part 3 and Part 4 illustrate the results. Selecting files – Setup window – ROI selection & analysis – Edge ID files – Speeding up runs […]