Search Results for: MTF
Henry’s Imatest Training Links
Here are Henry’s favorite Imatest Links that he often mentions during the Imatest Training Class: Day 1 Day 2 https://imatest.com/passfail/
Test Chart Substrate and Sizing Guide
This guide enumerates the possibilities and constraints of our test charts and provides resolution (MTF) information for the different options. Imatest has introduced Chart MTF Compensation, which can as much as double the resolution suitability of a given test chart. Inkjet Inkjet is the lowest resolution process we offer, but also the least expensive and most versatile. The minimum print size with inkjet is approximately 8” x 10”, and the maximum print size for a single sheet is 44” x 80”. Inkjet charts are available in three different substrates: Matte and Semigloss for reflective testing and DisplayTrans for transmissive tests […]
Imatest Reflective SFRplus Test Charts
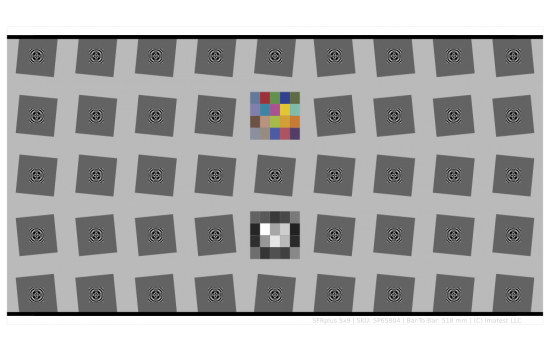
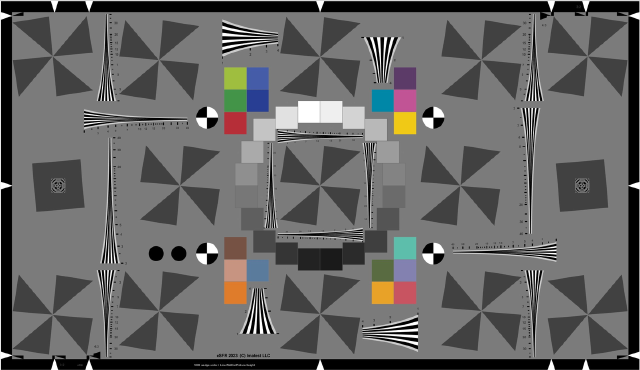
The Reflective SFRplus test chart can be used with the SFRplus module in Imatest 3.2 or later to measure MTF, lateral chromatic aberration, distortion, tonal response, and color accuracy. The SFRplus module features fully automated region-of-interest detection. The SFRplus chart offers significant advantages over commonly used charts such as the ISO 12233 chart, including:
- Better use of chart area
- The ability to produce a map of sharpness over the sensor surface
- Better measurement accuracy due to the lower contrast
- Full support for automated testing
Download PDF Info Sheet. See our Transmissive SFRplus charts here.
SFRreg Test Chart
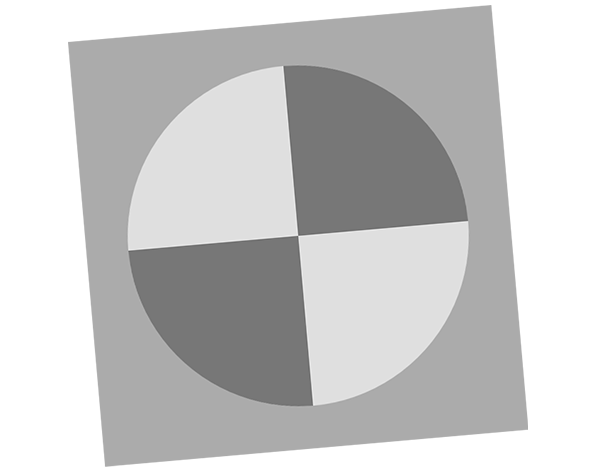
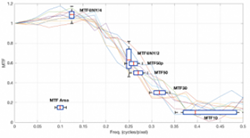
The SFRreg test target consists of a slanted-edge quadrant pattern enclosed within a circle. It is used for measuring MTF and lateral chromatic aberration. A test image typically contains several targets that are automatically detected and analyzed by Imatest beginning with Version 4.2.
Distortion Note: High amounts of distortion where the target may be compressed so that the major axis is 50% larger than the minor axis may have issues with autodetection. Pre-distortion may be necessary for these cases.
Electronic Imaging Symposium 2019

Join Imatest at the Electronic Imaging Symposium from Jan. 13 – 17 in Burlingame, California USA. Explore the entire imaging science ecosystem, from capture through image processing to how we and our surrogate machines see and interpret images. Henry Koren and Norman Koren will be presenting on the following. Reducing the cross-lab variation of image quality metrics Henry Koren As imaging test labs seek to obtain objective performance scores of camera systems, many factors can skew the results. IEEE Camera Phone Image Quality (CPIQ) Conformity Assessment Steering Committee (CASC) working group members performed round-robin studies where an assortment of mobile […]
December 2018 Reading List

Our team has outlined a list of our favorite imaging resources that we use on the job here at Imatest. Take a look at our top picks for the new year. Articles Determining MTF With A Slanted Edge Target This article by Douglas Kerr is a very digestible explanation (with diagrams) of the principles of slanted edge MTF testing. Blogs Image Sensors World Author Vladimir Koifman shares the latest news and discussions on image sensors and image sciencing technology. Books Digital Image Processing This book has been the foundational text for the study of digital image processing for over 40 […]
5 Common Pitfalls in Image Quality Testing
Having trouble with your Imatest test results? This article explains the five most common pitfalls in image quality testing, and how to resolve them. You’re using a chart with overly high contrast, like the obsolete ISO 12233 test chart. Your chart may have too high contrast edges. The most common example we see of this is the obsolete ISO 12233 test chart, although this can be the case with any test chart. If you are using the ISO 12233 2000 test chart, you should not be. The ISO 12233 2000 standard test chart has a very high contrast ratio (the […]
Considerations when evaluating a Near Infrared camera
Recent growth in the automotive and security industries has increased the number of cameras designed for viewing both Near Infrared (NIR) and visible wavelengths of light. NIR illumination is invisible to the human eye and can light a dark scene without being visible or annoying.
Increasing the Repeatability of Your Sharpness Tests
By Robert Sumner With contributions from Ranga Burada, Henry Koren, Brienna Rogers and Norman Koren Consistency is a fundamental aspect of successful image quality testing. Each component in your system may contribute to variation in test results. For tasks such as pass/fail testing, the primary goal is to identify the variation due to the component and ignore the variation due to noise. Being able to accurately replicate test results with variability limited to 1-5% will give you a more accurate description of how your product will perform.
ISO 12233 Edge SFR (eSFR) Inkjet chart
Imatest ISO 12233:2017 and ISO 12233:2023 eSFR charts are implementations of the Low Contrast Edge SFR (eSFR) test chart illustrated in Section 6.1 and Annex C of the ISO Standard Document. The chart is available in two general versions:
- Enhanced: extra squares, wedges, and color patterns when printed with technologies that allow color
- Extended: similar to Enhanced, but with a 16:9 aspect ratio, suitable for HDTV and cinema (Note: Works with Matlab esfrChart)
- All inkjet charts are available in either Visible or Near Infrared and Visible for testing cameras sensitive to wavelengths between 700-1000 nm. Specific spectral data available upon request. We currently offer these charts in inkjet format, with Enhanced versions available as photographic prints. All Imatest ISO 12233 eSFR charts are fully compliant with the ISO standard. The Imatest eSFR ISO module provides highly automated support for the new charts. Additional details below. Download PDF Info Sheet
Introducing Imatest 5.1
Our engineers are continually adding new features and updating Imatest software to provide you with the best analysis tool on the market. In our most recent release, our team has added several new modules to provide you better analysis tools.
Imatest 5.1
Version 5.1 has added several new features on top of the major enhancements made in version 5.0. Among the new features are MTF Compensation, Geometric Calibration, and Sony Sensor Image Acquisition. Not sure if you want it yet? Download a free trial. MTF COMPENSATION GEOMETRIC CALIBRATION DISTORTION CALCULATION TEMPORAL NOISE MEASUREMENTS SONY AYA IMAGE ACQUISITION SYNTHETIC RAW FILE CREATION