Chromatic Aberration AKA Color fringing

Introduction  |  Measurement  |  Modules  |  Demosaicing Purple fringing – CA correction for non-tangential edges Introduction Chromatic aberration (CA) is one of several aberrations that degrade lens performance. (Others include coma, astigmatism, spherical aberration, and curvature of field.) It occurs because the index of refraction of glass varies with the wavelength of light, i.e., glass bends different colors by different amounts. This phenomenon is called dispersion. It appears as color fringing, most visibly on tangential edges near the boundaries of the image. It is sometimes confused with another effect, which we call pixel shift— a color channel offset that is […]

Checkerboard INI file reference

For more information on how to use INI files in Imatest IT, we recommend the Imatest INI File Reference This document was created by running checkerboard in Imatest 5.2.0. ALPHA on 30-May-2019 22:57:20. For Imatest IT, most of these entries don’t need to be entered. Many don’t affect Imatest IT results: they control interactive figure displays or figure output formats (figures are often not used in Imatest IT). Background Meaning Yellow Yellow background: Important to Imatest IT. Parameter and Description are in boldface. [IT] Cyan Cyan background: Figure settings. (Figures are used infrequently for IT.) [f] Gray Gray background: For […]

Chart Quality Calculator

Imatest lets you use the measured test chart modulation transfer function (MTF) to Determine the suitability of a test chart, which is characterized by size (height), print media, and printing technology, for camera MTF measurements where the camera is characterized by the number of vertical pixels. This can help determine whether a test chart is appropriate for a specific application.  Increase the accuracy of MTF measurements by dividing the measured camera MTF by the chart MTF projected on the image sensor. This is equivalent to deconvolution in spatial domain. This technique is described in Compensating camera MTF measurements for chart and […]

Chart Quality Index (CQI) (deprecated)

Imatest 5.1 has important new capabilities for measuring and correcting MTF degradation caused by test charts. These new capabilities are far easier to understand and apply than CQI. Chart quality calculator Compensating camera MTF measurements for chart and sensor MTF As a result of the improved measurements, the Chart Quality Index measurement has been deprecated. The Chart Finder is an interactive web page that can help you select the appropriate chart size and media. It contains results from this page, but without the math. Summary In order to determine the suitability of a test chart is for measuring the performance of a […]

Batchview

Postprocessor for viewing summaries of SFR, SFRplus, Checkerboard, and eSFR ISO results Introduction to Batchview Batchview is a postprocessor for displaying lens test results generated by SFR, SFRplus, and eSFR ISO batch runs (analyses of groups of test chart images taken at various apertures, focal lengths, etc.). It can store and display up to four sets of results for convenient comparisons in Imatest Master; two in Studio. Postprocessor comparison Each lets you compare sharpness of different regions and/or images MTF Compare Postprocessor to SFR, SFRplus, and eSFR ISO. Input is two CSV results files for individual regions. Lets you compare individual […]

Autofocus Speed

Imatest 4.4+ can evaluate auto-focus (AF) as a measure of MTF with respect to time. This can be performed by using the SFR module with an appropriate video file. Related pages Auto Exposure in Stepchart Autofocus Speed in SFR Auto White balance in Colorcheck Uses/Purpose This metric is intended to be used as a way to measure the time a camera system takes to auto-focus. Rise time and settling time are automatically calculated. This measurement does not provide information about the accuracy or precision of auto-focus. To evaluate those measures, several measurements should be performed on the final, settled images and compared. File […]

Arbitrary Charts Module Settings

Analyses & Output – INI settings – Chart Definition Files – Chart Definition Utility   INI file fields relevant to Arbitrary Charts The following INI fields are currently exposed to the user to control the behavior of the Arbitrary Charts module and its output. They have been organized here by topic, but do not need to be in any particular order or grouping in your INI file itself.    [arbcharts] section Slanted-edge Analysis     Texture Analysis   Star Analysis   Wedge Analysis   Uniformity Grid Analysis   Color/Tone/Noise   Perceptual metrics   Module operation and misc.   [api] section   […]

Arbitrary Charts Analyses and Output

Analyses & Output – INI settings – Chart Definition Files – Chart Definition Utility   Data outputs from the Arbitrary Charts Module are different from other modules in Imatest: Only JSON files are output, not CSV or XML. The structure of JSON is substantially different than other modules.  If several images are run in a batch, results from all images may be contained in a single JSON. Since the Arbitrary Charts Module is based on the concept of a custom layout of features, there is no fixed structure to the measurement results that the Module produces. Instead, the module simply produces […]

Arbitrary Charts

Analyses & Output – INI settings – Chart Definition Files – Chart Definition Utility   Combine all the features you need to analyze into a single chart Introduction The Imatest™ Arbitrary Charts module analyzes images of custom test charts. A chart-definition file (typically user defined) is needed to describe the chart layout to Imatest software. The Arbitrary Charts module will automatically locate and analyze target features when an observed image of a chart is loaded along with the corresponding definition file.    This module allows users to get a number of measurements out of custom, legacy, or competitors’ charts which are unsupported […]

Acutance and SQF (Subjective Quality Factor)

Introduction to Acutance and SQF   Acutance and Subjective Quality Factor (SQF) are measures of perceived print or display sharpness. SQF was used for years in the photographic industry but has remained unfamiliar to most photographers. Acutance is a relatively new measurement from the IEEE Camera Phone Image Quality (CPIQ) group. Both are metrics which incorporate the effects of The imaging system: The Modulation Transfer Function (MTF) of the camera as a measurement of its intrinsic sharpness. The viewer: The human eye’s sensitivity to each spatial frequency modeled with a Contrast Sensitivity Function (CSF). The viewing conditions: The image display height […]

Documentation – v22.1

View Release Notes     For beginners: We recommend these web pages for getting started: Introduction to the new Imatest Main Window (New in 2021.2) Image Quality Factors and Using Imatest – Getting started. VIDEOS– Online training – Consulting – News   Index of the Table of Contents Offline documentation Download the website for offline view (with a web browser) Image Quality  IQ factors (KPIs) measured by Imatest, with links to detailed descriptions and instructions. Sharpness  Introductions to sharpness and sharpening; comparisons of different charts; chart quality limitations & how to overcome them Other IQ factors  Noise, SNR, Temporal noise, […]

Imatest Transmissive SFRplus Test Chart

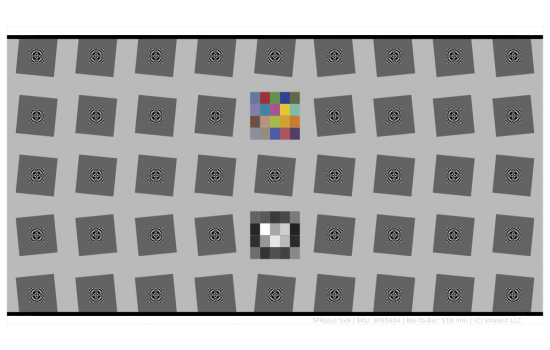
The Transmissive SFRplus test charts can be used with the SFRplus module in Imatest 3.2 or later to measure MTF, lateral chromatic aberration, distortion, tonal response, and color accuracy. The SFRplus module features fully automated region-of-interest detection. The SFRplus chart offers significant advantages over commonly used charts such as the ISO 12233 chart, including:

  1. Better use of chart area
  2. The ability to produce a map of sharpness over the sensor surface
  3. Better measurement accuracy due to the lower contrast
  4. Full support for automated testing

Download PDF Info Sheet. See our Reflective SFRplus charts here

Logarithmic wedges: a superior design

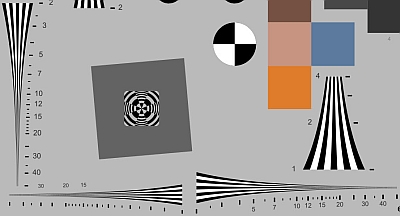
We introduce the logarithmic wedge pattern, which has several advantages over the widely-used hyperbolic wedges found in ISO 12233 (current and older) and eSFR ISO charts. The key advantage of logarithmic wedges is that charts with large fmax/fmin ratios work well for systems with a wide range of resolutions, unlike hyperbolic wedges, where large ratios cause high frequencies occupy excessive real estate and low frequencies to become highly compressed. The fmax/fmin ratio of the hyperbolic wedges in the ISO 12233/2017 chart is only 12.5:1 — insufficient for modern high resolution cameras.

How to compute resolution in TV Lines (TVL)

Television Lines (TVL) are derived from the EIA 1956 testing standard, where they are defined as the number of light and dark vertical lines that are visible (i.e., distinguishable) over the height of the screen. TVL defines “lines” as distinct dark and light lines. This is equivalent to Line Widths (LW), and should not to be confused with Line Pairs (LP), which represent a complete cycle, i.e., one TV line is equivalent to half a line pair. Although TVL is not the best measurement of digital imaging system quality, it can be useful for comparing digital systems with older analog systems. […]

Wedge

Analysis of hyperbolic or trapezoidal wedge patterns with the Imatest Wedge and eSFR ISO modules News– 2021.1.  In Imatest 2020.2 calculations were greatly sped up in order to improve performance of direct image acquisition. During the testing of the speedup with direct acquisition, we found that Wedge results were unstable during repetitive acquisitions— that noise could cause significant variation from one image to the next. To make results more stable, we made a great many changes to the wedge calculation, most notably increasing smoothing in the bar count and MTF measurements.  As a result of these improvements, 2021.1 results are […]

Version Comparison: Studio vs. Master

Which version is right for you? Imatest 5.0:  All functions of Imatest Image Sensor have been incorporated into Imatest Master.   Imatest is available in several GUI (Graphic User Interface)-based versions. Studio, with everything individual photographers need to test their cameras and lenses. Studio is only available to individual photographers. Master, the full-featured industrial-strength version for engineers and scientists who develop and evaluate imaging systems. Acquire images directly from several manufacturer’s development systems. Images can be updated and analyzed in real time with the Rescharts, Multicharts, and Uniformity-Interactive modules. As of Imatest 5.0, Image Sensor (IS) has been discontinued. All […]

Validating the Imatest slanted-edge calculation

Introduction Imatest’s slanted-edge algorithms for calculating MTF/SFR are based on ISO 12233 standard, “Photography – Electronic still picture cameras – Resolution measurements”. Although this standard is well-established in industry, we often receive questions regarding its validity. This document describes methods for validating the Imatest slanted-edge method for calculating image sharpness (expressed as Modulation Transfer Function, MTF, which is synonymous in practice with Spatial Frequency Response, SFR). MTF is a measurement of image contrast as a function of spatial frequency. As such, it is a measure of device or system sharpness, which is only indirectly related to perceived image sharpness in […]

Using Test Charts

Create test charts for high quality inkjet printers Although we strongly recommend that customers purchase charts from the Imatest Store, the Imatest Test Charts module allows you to create test chart files for printing on high quality photographic inkjet printers. If you plan to print charts using this module, you should be skilled at fine printing and have a knowledge of color management to obtain optimum chart quality; otherwise we recommend purchasing charts at the Imatest Store. Disclaimer: Although we sell most of the charts generated by the Imatest Test Charts module, several variations are not available because (A) it’s […]

Using SFRreg, Part 3: Results

Imatest SFRreg performs highly automated measurements of sharpness (expressed as Spatial Frequency Response (SFR), also known as Modulation Transfer Function (MTF)) and Lateral Chromatic Aberration from images that contain registration mark patterns (circles that contain two light and two dark quadrants). This document illustrates SFRreg results. Part 1 introduced SFRreg and explained how to obtain and photograph the chart. Part 2 showed how to run SFRreg inside Rescharts and how to save settings for automated runs.   SFRreg results When calculations are complete, results are displayed in the Rescharts window, which allows a number of displays to be selected. The following […]

Using SFRreg, Part 2: Running SFRreg

Running SFRreg (Interactive and Auto mode settings) Setup window – ROI numbering – More settings – SFRreg target detection Auto mode settings – Warnings – Summary Imatest SFRreg performs highly automated measurements of sharpness (expressed as Spatial Frequency Response (SFR), also known as Modulation Transfer Function (MTF)) and Lateral Chromatic Aberration from images that contain registration mark patterns (circles that contain two light and two dark quadrants). This document shows how to run SFRreg in Rescharts and how to save settings for automated runs. Part 1 introduced SFRreg and explained how to obtain and photograph the chart. Part 3 illustrates the […]