Search Results for: MTF
SFRplus Charts for GTI Light Boxes

The SFRplus test chart can be used with the Imatest SFRplus module to measure MTF, lateral chromatic aberration, distortion, and tonal response. The SFRplus module features fully automated region-of-interest detection. The SFRplus chart offers significant advantages over commonly used charts such as the ISO 12233 chart, including 1) much less wasted area, 2) the ability to produce a map of sharpness over the sensor surface, 3) better measurement accuracy due to the lower contrast, and 4) full support for automated testing.
These transmissive charts are designed to mount directly into the light boxes produced by GTI. The bar-to-bar height and width of the total chart are designed and cut to fit into the GTI light boxes with as little light bleed as possible.
SFRplus Large LVT Film Chart
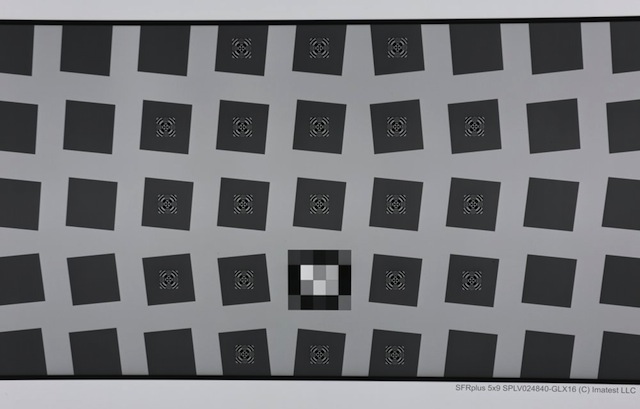
This transmissive (backlit) SFRplus test chart can be used with the Imatest SFRplus module to measure MTF, lateral chromatic aberration, distortion, and tonal response. The SFRplus module features fully automated region-of-interest detection. The SFRplus chart offers significant advantages over commonly used charts such as the ISO 12233 chart, including 1) use of space, 2) the ability to produce a map of sharpness over the sensor surface, 3) better measurement accuracy due to the lower contrast (4:1), and 4) full support for automated testing.
Size
This chart has an active chart area of 48.3 cm x 26.81 cm (19 in x 10.56 in) in a total film size of 30.48 cm x 50.8 cm (12 in x 20 in). Bar-to-bar height is 252 mm (9.92 in).
Email charts@imatest.com for current availability and lead time.
Lync RevF Implementation
This is a review of Microsoft Doc#: H100693 to see what testing criteria Imatest Master and Imatest IT can satisfy. Please contact support@imatest.com with any questions. Certification Metric Pg# Status Notes Support USB Video Class (UVC) Driver 11 Not Supported no plan to support, instructions for checking driver included Support USB Audio Class (UAC) Driver 12 Not Supported no plan to support, instructions for checking driver included Product driver signed by Microsoft (WHQL) 13 Not Supported no plan to support, instructions for checking driver included Method to control video processing in driver/camera 13 Not Supported Executables for testing face detection […]
Color Spilled Coins (Dead Leaves) Test Chart
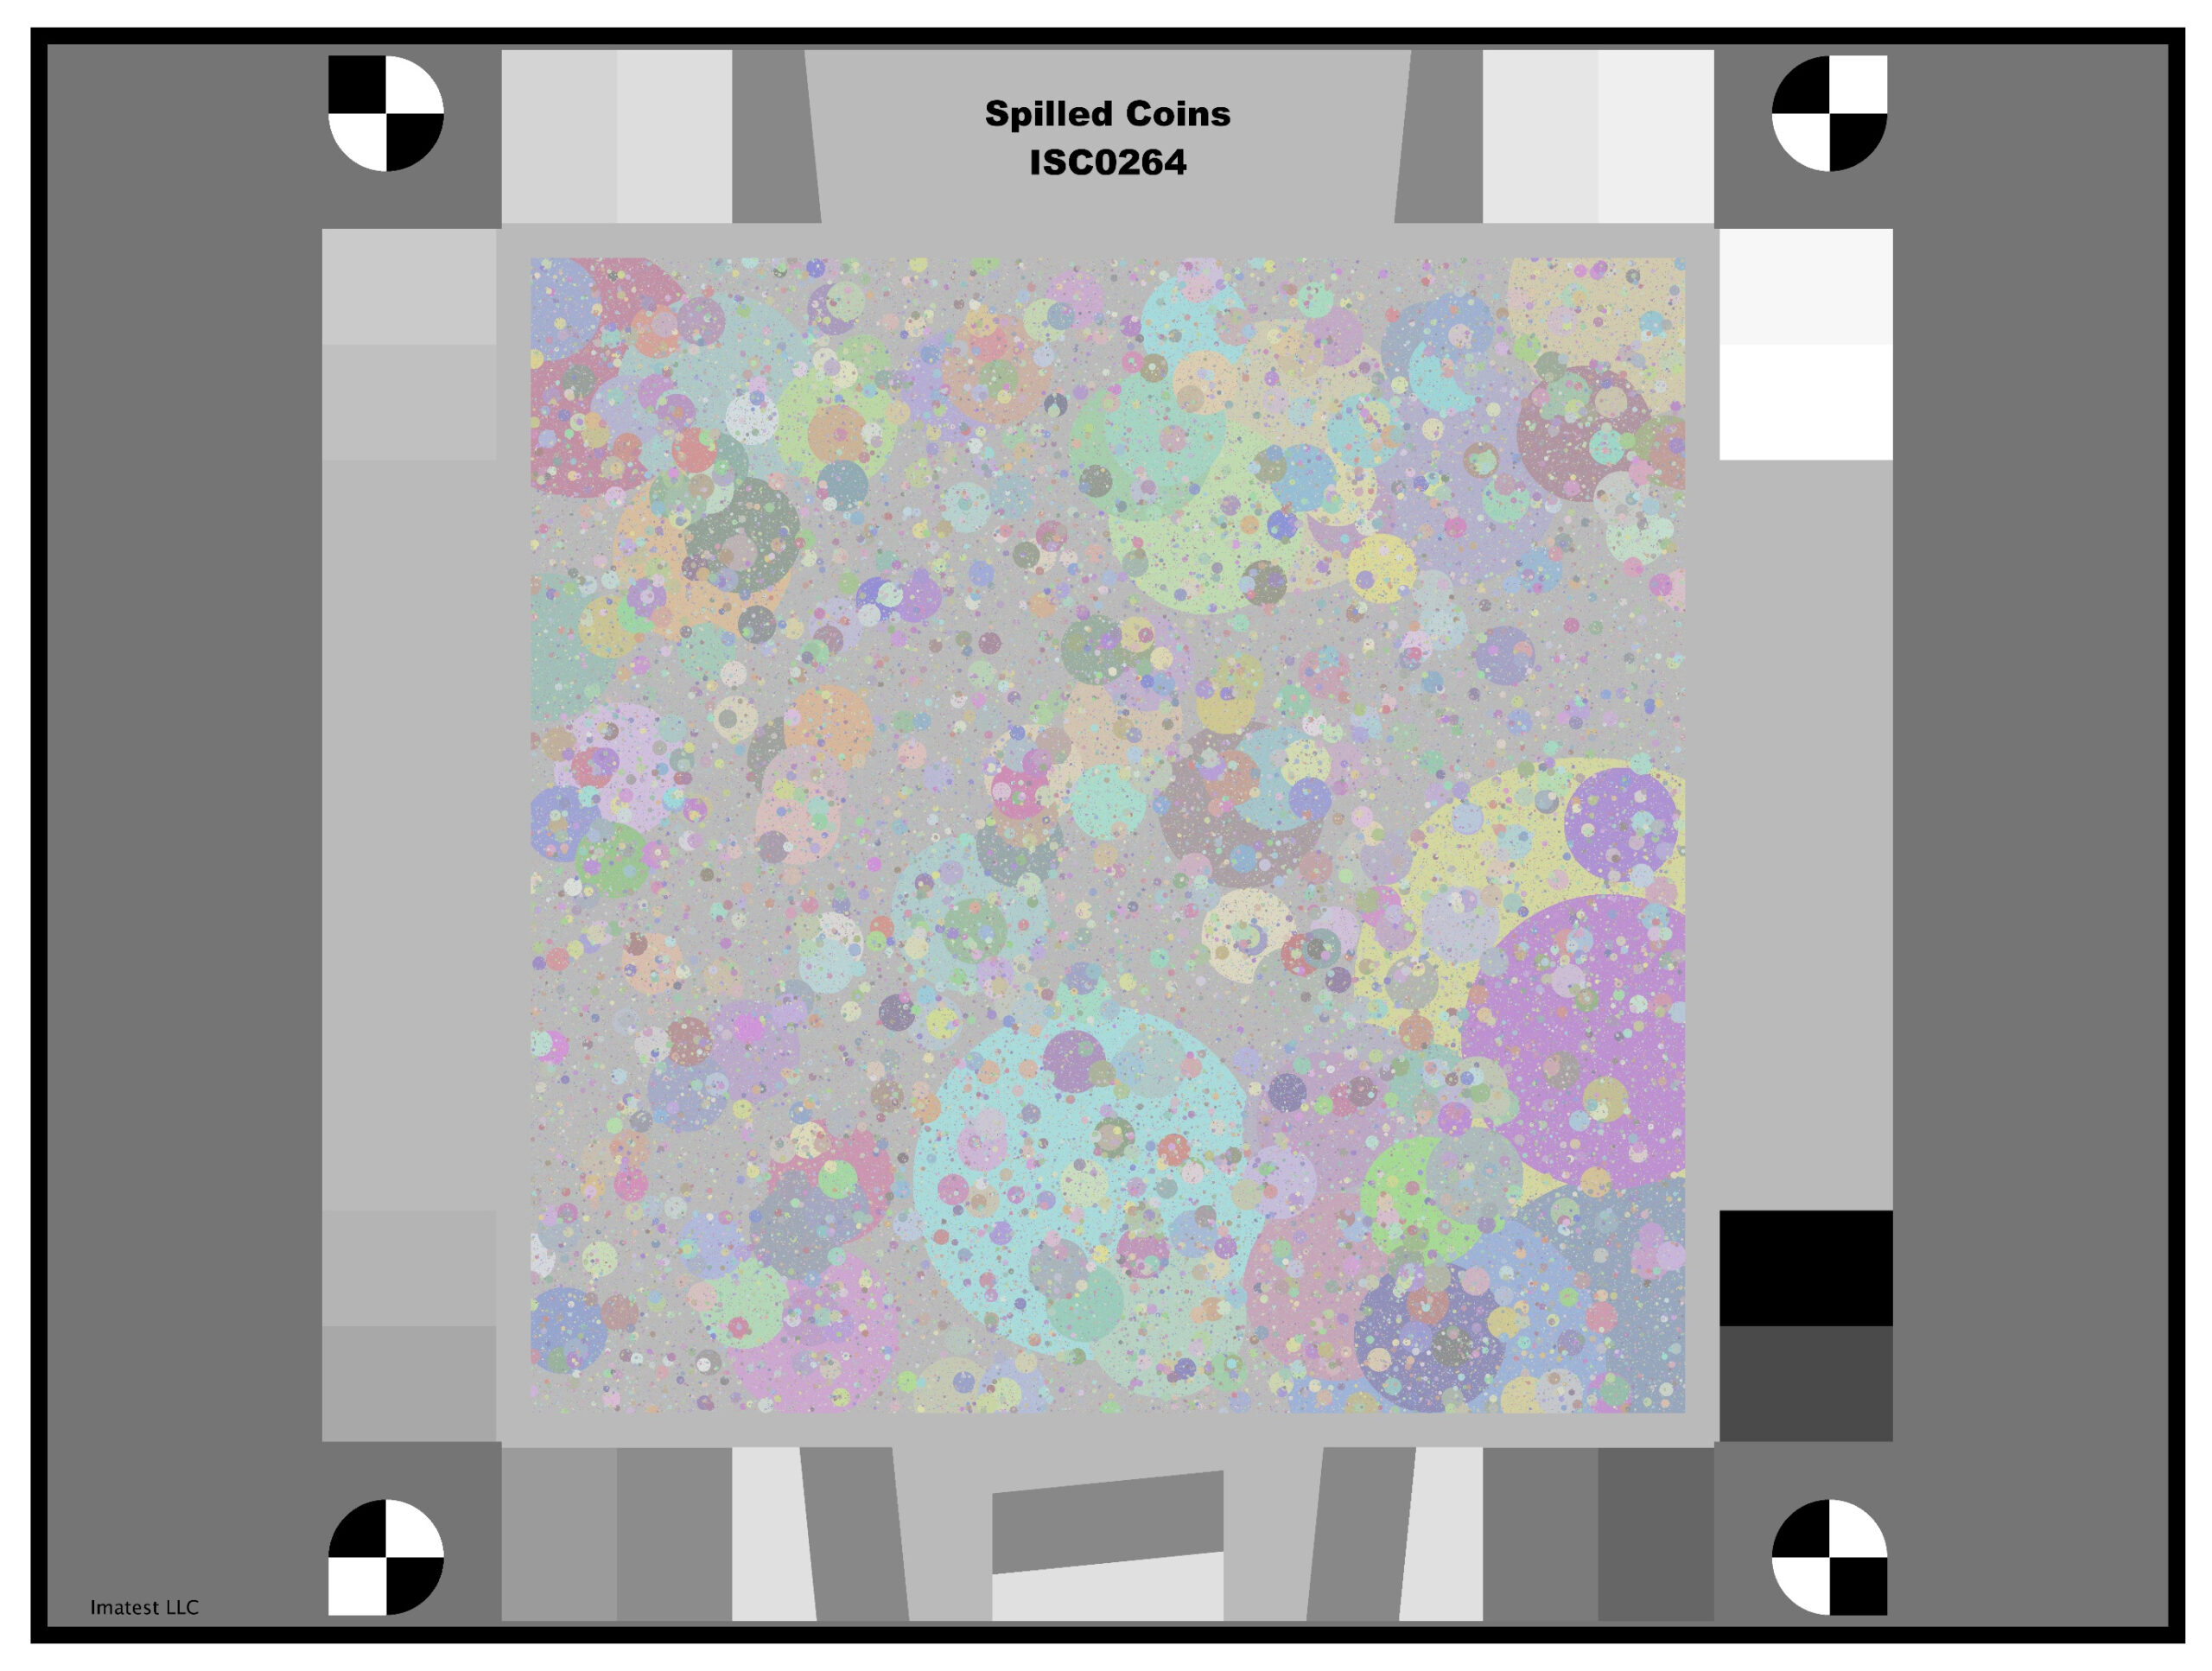
The Color Imatest Spilled Coins chart is a variant of the Dead Leaves chart designed to measure texture sharpness. It has several advantages over older Dead Leaves charts, including nearly perfect scale-invariance, which improves the accuracy and robustness of measurements, and gray regions to the left and right of the chart that facilitate noise removal (using a technique where gray patch noise Power Spectral Density is subtracted from the signal + noise PSD of the central Spilled coins region).
Read more about Random/Dead Leaves chart analysis in the Imatest documentation.
Imatest 3.9 Released
Imatest 3.9 was released on December 14th 2012. Please contact sales@imatest.com for purchase or renewal information. Here is a complete list of changes: Imatest main window: Explore image file folder and Explore recent save folder have been added to the File dropdown. INI File Settings have been given their own dropdown to minimize clutter. Explore INI file folder has been added. The INI file Editor (useful for fixing errors and for setting up INI files for the Functional Interface and IT) has been greatly enhanced.
Black & White Imatest Spilled Coins (Dead Leaves) Test Chart
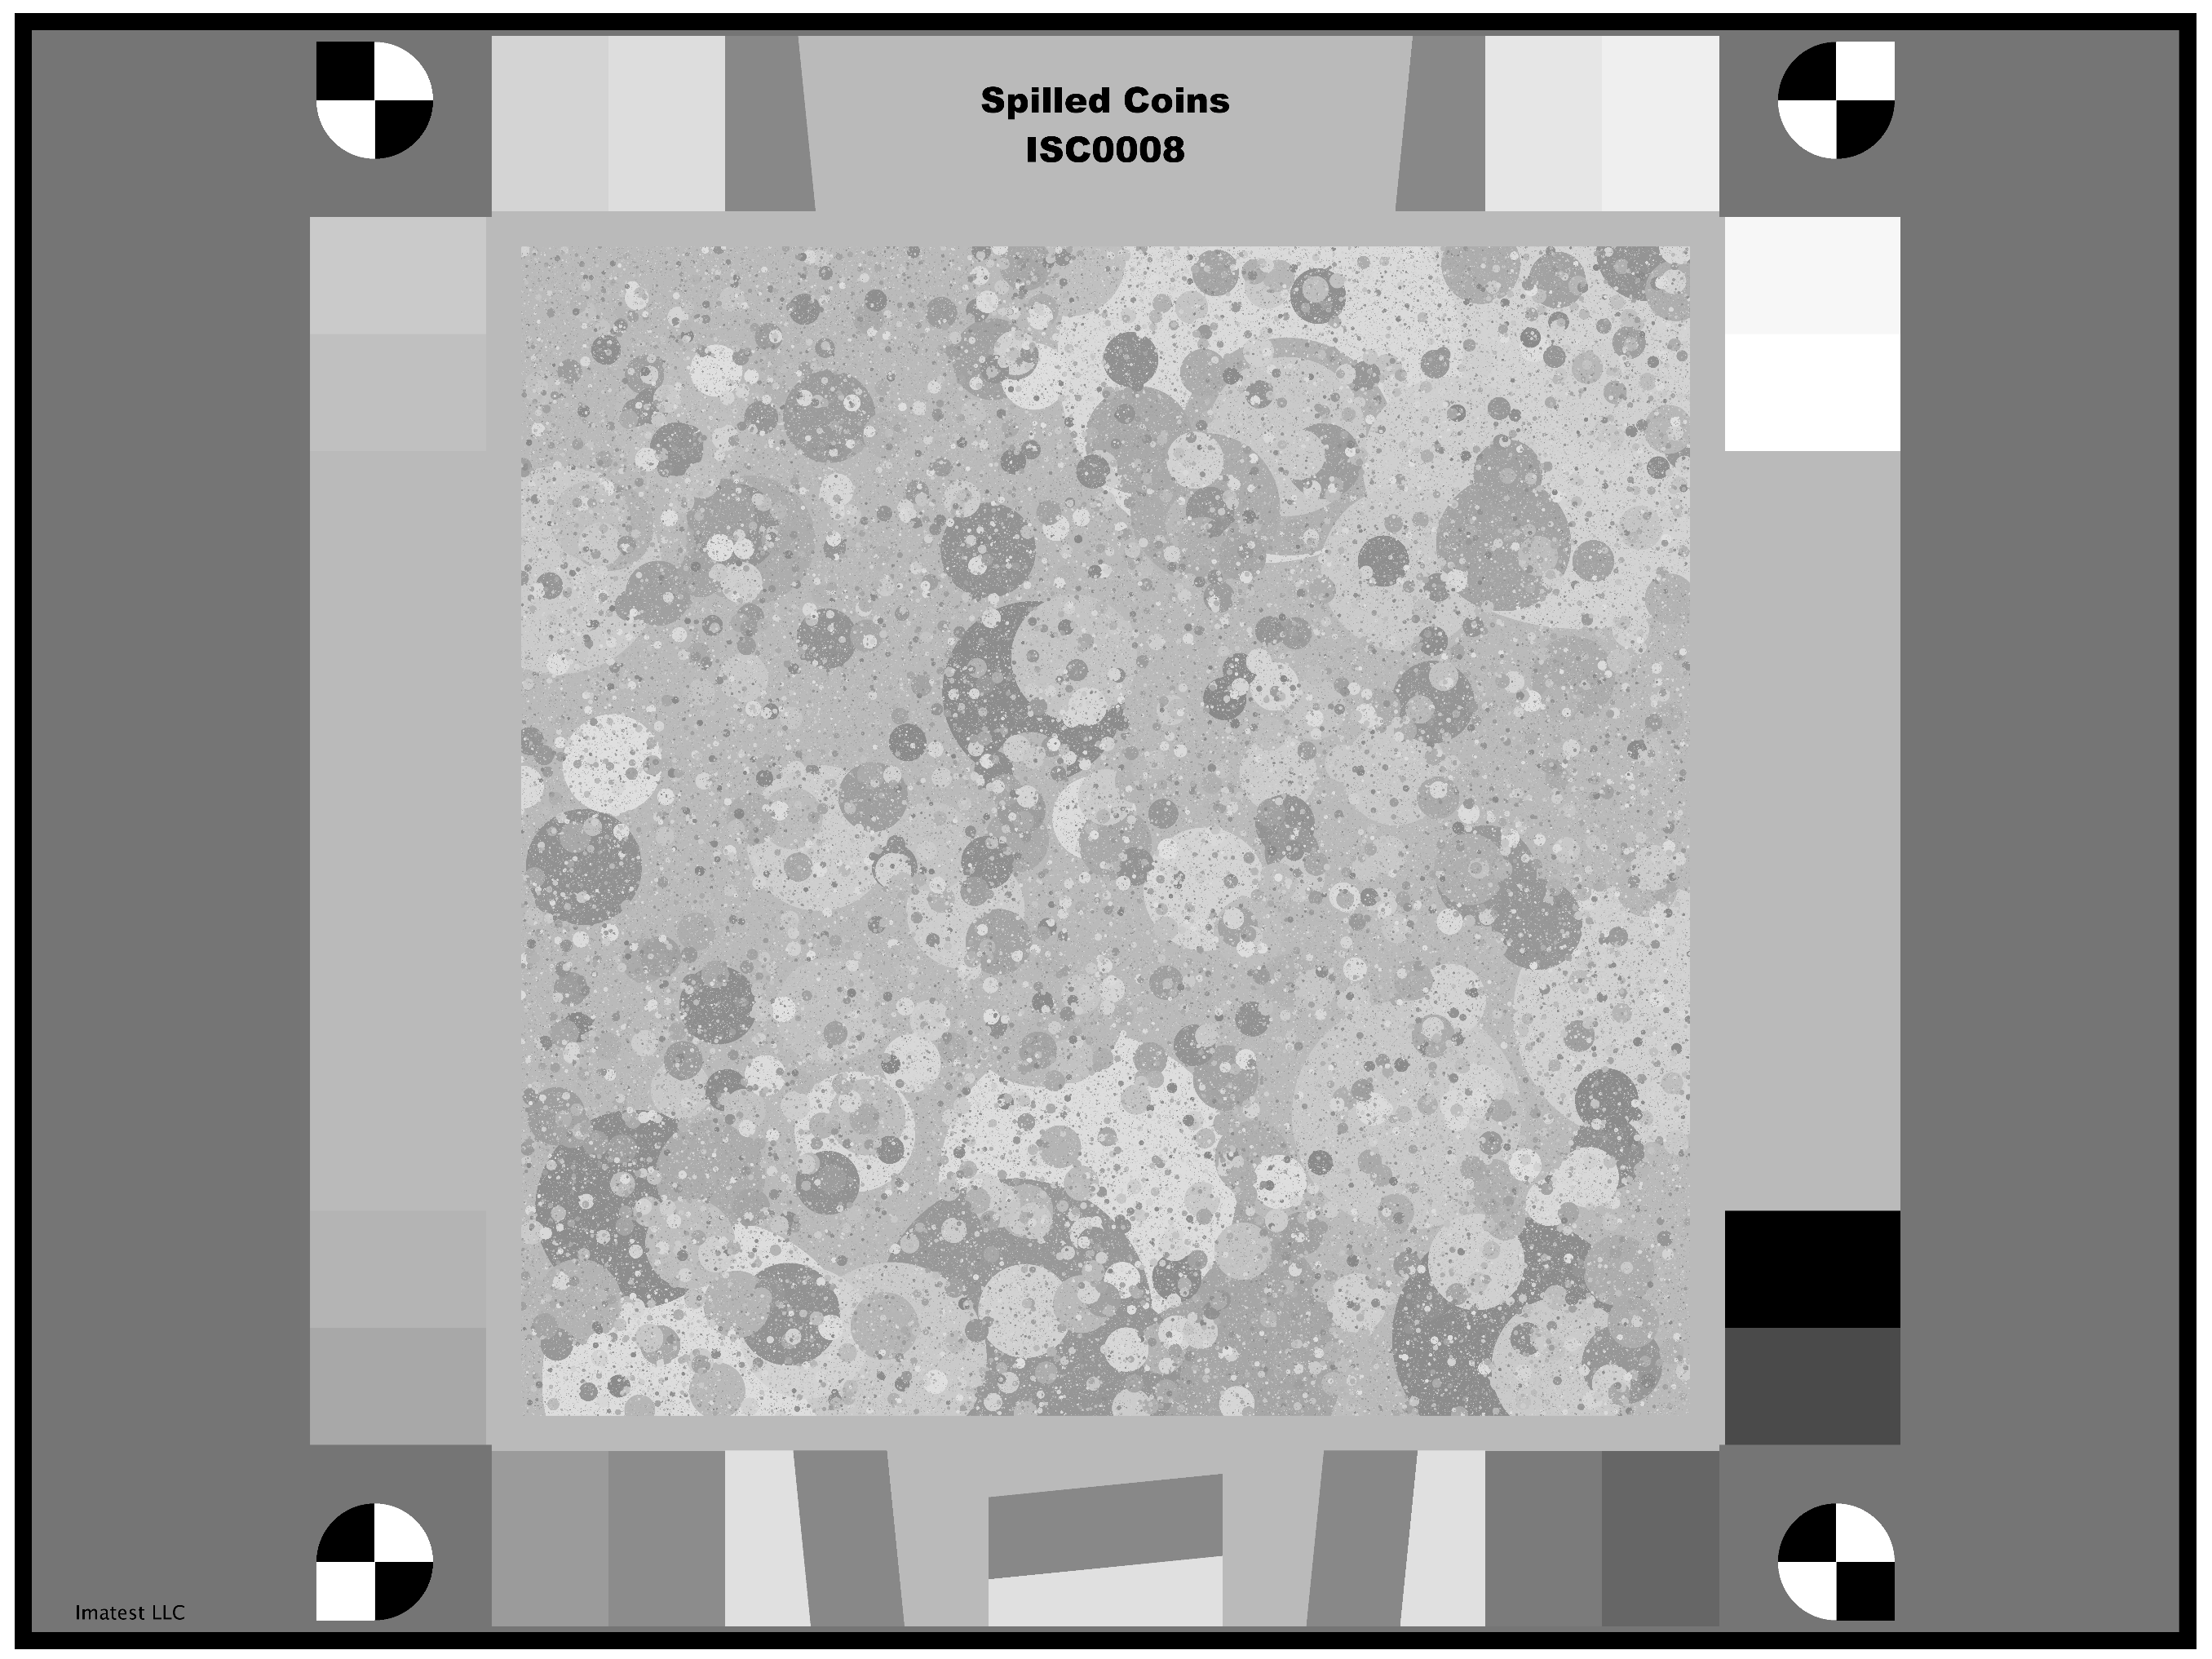
The Imatest Spilled Coins chart is a variant of the Dead Leaves chart designed to measure texture sharpness. It has several advantages over older Dead Leaves charts, including nearly perfect scale-invariance, which improves the accuracy and robustness of mesurements, and gray regions to the left and right of the chart that facilitate noise removal (using a technique where gray patch noise Power Spectral Density is subtracted from the signal + noise PSD of the central Spilled coins region).
Read more about Random/Dead Leaves chart analysis in the Imatest documentaion.
SFRplus Quadrants
The chart corner quadrants are defined as follows: Quadrants of the SFRplus chart In the table below, the center square is Row 0, Column 0 (R0,C0), and Row number R increases from top to bottom. Note that some squares are not included in a quadrant. Chart quadrants are detected automatically; no changes to the input (Edge ID file, etc.) are needed. Region Row R, Column C Center -1 ≤ R ≤ 1; -1 ≤ C ≤ 1 UL R ≤ -1; C ≤ -2 LL R ≥ 1; C ≤ -2 UR R ≤ -1; C ≥ 2 LR R ≥ 1; C ≥ 2 […]
Slanted-Edge SFR Saturation
The following (Rescharts) SFRplus results shows the edge (unnormalized) and MTF results for one region near the center of the image that has the green channel saturated. (We deliberated boosted the image to saturate it.) The green channel is very clearly saturated, but luminance doesn’t quite reach saturation because of the low level of the blue channel. Note the sharp corner where the green channel reaches saturation. This corner has quite a lot of high frequency energy that is responsible for the high MTF of the green channel: MTF50 = 435 LW/PH, about 15-20% higher than the other channels. SFRplus […]
Measuring the Effects of Tilt
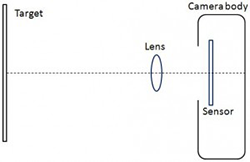
Summary: The physical lens-to-sensor tilt angle is difficult to measure from images, but the effects of tilt on image quality are highly measurable, and can be included in pass-fail criteria.