Imatest December 2014 Newsletter

Wishing all our customers, partners and resellers very happy holidays and a prosperous New Year. Imatest is offering 25% off all software support renewals through the end of the year.

Slanted-Edge versus Siemens Star, Part 2

A comparison of sensitivity to signal processing: Results for additional cameras This page contains additional Slanted-edge, Siemens Star, and Log F-Contrast results for four cameras, in support of claims in Slanted-edge versus Siemens Star that Siemens Star MTF measurements are nearly as sensitive to sharpening as low-contrast (4:1) slanted-edge measurements. The Siemens Star’s high contrast (specified at >50:1) makes it quite sensitive to saturation and to “shoulders” (regions of reduced contrast) in camera tonal response. Slanted-edge MTF measurements are stable, reliable, and more representative of perceived image sharpness under a wide range of conditions (in addition to their many well-known […]

Imatest 4.0 Release

Imatest is proud to announce the official release of its new 4.0 image quality testing software. The Imatest 4.0 upgrade includes a number of refinements including enhanced automation capabilities and a more robust image quality testing experience.

Slanted-Edge versus Siemens Star: A comparison of sensitivity to signal processing

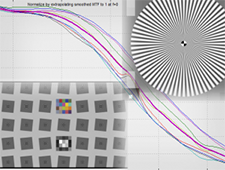
This post addresses concerns about the sensitivity of slanted-edge patterns to signal processing, especially sharpening, and corrects the misconception that sinusoidal patterns, such as the Siemens star (included in the ISO 12233:2014 standard), are insensitive to sharpening, and hence provide more robust and stable MTF measurements. April 2024. We have a new document that compares slanted-edges with Siemens stars. (I’m embarrassed to say I’d forgotten the existence of this post.) Slanted edge vs. Siemens star MTF calculations: 2024 white paper We compared images (simulated, JPEG, and raw; demosaiced and one undemosaiced) that contained a Siemens star and slanted edges. We […]

Slanted-Edge versus Siemens Star

A comparison of sensitivity to signal processing In this page we address concerns about the sensitivity of slanted-edge patterns to signal processing, especially sharpening, and we correct the misconception that sinusoidal patterns, such as the Siemens star, are insensitive to sharpening, and hence provide more robust and stable MTF measurements. The Siemens Star is of particular interest because, along with the slanted-edge, it is included in the ISO 12233:2014 standard.  To summarize our results, we found that sinusoidal patterns are sensitive to sharpening, though often less so than low contrast (4:1) slanted-edges. The relatively high contrast of the Siemens Star […]

Using eSFR ISO Part 3: Results

Imatest eSFR ISO results Imatest eSFR ISO performs highly automated measurements of several key image quality factors using one of three versions of the ISO 12233:2014 Edge SFR chart: Standard, Enhanced, or Extended. Unlike most other modules, the user never has to manually select Regions of Interest (ROIs). Image quality factors include Sharpness, expressed as Spatial Frequency Response (SFR), also known as the Modulation Transfer Function (MTF), Noise, measured from the grayscale patches surrounding the center of the chart, includes all types of noise calculated by Color/Tone Interactive and Color/Tone Auto (standard pixel noise, chroma noise, scene-referenced noise, sensor (raw) […]

Using eSFR ISO Part 2

Running eSFR ISO – Rescharts eSFR ISO – eSFR ISO setup window – Speeding up – More Settings window – Secondary Readouts – Gamma – Auto mode settings – Warnings – eSFR ISO summary Running eSFR ISO Imatest eSFR ISO performs highly automated measurements of several key image quality factors using one of three versions of the ISO 12233:2014 Edge SFR chart: Standard, Enhanced, or Extended. This document shows how to run eSFR ISO in Rescharts and how to save settings for automated runs. Part 1 introduced eSFR ISO and explained how to obtain and photograph the chart. Part 3 […]

Using eSFR ISO Part 1

Imatest eSFR ISO performs highly automated measurements of several key image quality factors using versions of the new ISO 12233:2014 E-SFR (Edge SFR) test chart that may be purchased from the Imatest store (recommended) or printed on a high-quality inkjet printer. Region of Interest (ROI) selection is automatic, based on user-entered criteria (similar to  SFRplus, which it closely resembles). Image quality factors include: Sharpness, expressed as Spatial Frequency Response (SFR), also known as Modulation Transfer Function (MTF) Lateral Chromatic Aberration Distortion (with less detail than the Distortion module). Details in SFRplus Distortion and Field of View measurements. Noise, measured from the […]

Pre-distorted and special charts for Fisheye Lenses

SFRplus and eSFR ISO can tolerate moderate amounts of optical distortion (pincushion or barrel), but they have definite limits. In this page we describe special versions of SFRplus and eSFR ISO charts that can work with highly barrel-distorted (“fisheye“) lenses, with fields of view up to around 160 degrees— which are used in a number of applications, particularly for automotive rear-view and sports cameras. Cameras with fields of view over 160 degrees— even approaching 360 degrees— can be tested with the SFRreg module, which uses multiple individual “registration mark” charts facing the camera. Pre-distorted charts should only be used with […]

Videos

Categories About Imatest Getting Started Image Quality Factors Software Releases Product Overview In the Lab Measuring & Reading IQ Plots Webinars Industry Events Standards Speeding up videos About Imatest Getting Started     Image Quality Factors   Software Releases Product Overviews     In the Lab Measuring and Reading IQ Plots   Webinars     Industry Events   Speeding up videos A Video Speed Controller is available on the chrome web store. If you prefer to use the console, follow these steps for Google Chrome: Open the video. Hit ctrl+shift+I or right-click then choose Inspect to view the HTML for […]

The Imatest Pass/Fail Monitor

The Pass/Fail monitor (introduced In Imatest 4.0) provides a real-time indication of whether a device has passed or failed a test. It saves the trouble of digging through results— in figures or CSV or JSON files. Key features: It can stay open while modules run, displaying results immediately after calculations are complete. It works best on systems with a high resolution screen or dual screens. It interfaces with most Imatest analysis modules. It can be extremely valuable for developing and testing Pass/Fail criteria for Imatest IT (Industrial Testing). It can call several utilities for helping with this process. It displays […]

Speeding Up Imatest IT with INI File Settings

This article focuses on how to improve the performance of Imatest IT testing using configuration (ini file) settings. Limiting the number of regions used to test, limiting the size of the regions API Section Settings Disable messages and figures [api] nomsg = 1 disable_figs = 1 Settings for Slanted-Edge modules: SFR, SFRplus, eSFR ISO, Checkerboard, SFRreg Many of the settings described here are also listed in  Using Rescharts slanted-edge modules Part 2: Speeding up runs. (Although Imatest IT does not run Rescharts directly, Rescharts is used in Imatest Master to make and save settings that can be used in several […]

Sharpness and Texture Analysis using Log F‑Contrast from Imaging-Resource

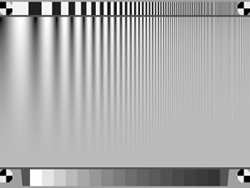
Imaging-resource.com publishes images of the Imatest Log F-Contrast* chart in its excellent camera reviews. These images contain valuable information about camera quality— how sharpness and texture response are affected by image processing— but they need to be processed by Imatest to reveal the important information they contain. *F is an abbreviation for Frequency in Log F-Contrast.

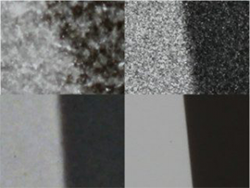
Reflective Chart Quality Comparison: Inkjet vs. Photographic

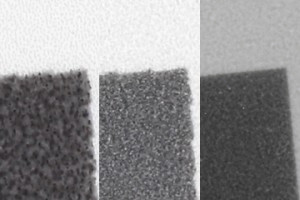
In our last chart quality investigation we looked at the fine detail of transmissive (backlit) test charts. Now we will look in to the properties of reflective charts. Imatest currently offers three types of reflectively-illuminated test chart. Most of the charts we produce are printed on a high quality inkjet printer on matte or semi-gloss (luster) papers. We also have a chart that is produced with a photographic process. We will determine which of these substrates has the sharpest edge and quantify the difference.

No Perfect Lens, No Perfect Lens Test

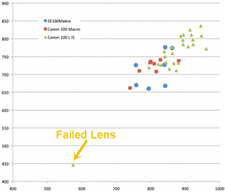
Roger Cicala of LensRentals.com has completed the second part of his two part series investigating lens testing.

Imatest Image Acquisition with Omnivision OVTAPantherM

Introduction This page briefly illustrates how to use the Imatest with Omnivision OVTAPantherM. Please note that Omnivision cameras are not supported in the OSX and Linux version of Imatest. However, Imatest supports other development systems to varying degrees. Contact us for details. Load images directly from Omnivision sensors. This eliminates the need to capture images separately, store them, then load them individually into Imatest, dramatically improving productivity. Download and Install Software To download Imatest software, go to store.imatest.com/software.html Download and open the self-extracting executable (Imatest-IS-3.n.exe). This will install the Imatest Master edition and the Matlab Compiler Runtime (MCR), which is required […]

Imatest 3.10 Released

The release of version 3.10 of Imatest brings a host of improvements to make image quality testing faster and more relevant to advances in cameras. Look for performance, stability, interface and measurement improvements across the board as well as some excellent new modules and features.

Transmissive Chart Quality Comparison

Imatest currently sells several transmissive (backlit) test charts, which have a range of substrates, each with specific properties and qualities that are in process of being quantified. The following comparison of the most important of our transmissive substrates was prepared in response to several customer inquiries.

Measuring Test Chart Patches with a Spectrophotometer

Using Babelcolor Patch Tool or SpectraShop 4 This post describes how to measure color and grayscale patches on a variety of test charts, including Imatest SFRplus and eSFR ISO charts, the X-Rite Colorchecker, ISO-15729, ISO-14524, ChromaDuMonde CDM-28R, and many more, using a spectrophotometer and one of two software packages. Babelcolor PatchTool  which works with reflective test charts Robin Myers SpectraShop 4  which works with both reflective and transmissive (backlit) test charts

Chart Quality Index (CQI) (deprecated)

Imatest 5.1 has important new capabilities for measuring and correcting MTF degradation caused by test charts. These new capabilities are far easier to understand and apply than CQI. Chart quality calculator Compensating camera MTF measurements for chart and sensor MTF As a result of the improved measurements, the Chart Quality Index measurement has been deprecated. The Chart Finder is an interactive web page that can help you select the appropriate chart size and media. It contains results from this page, but without the math. Summary In order to determine the suitability of a test chart is for measuring the performance of a […]