Rescharts slanted-edge modules Part 4: Other results

Imatest Rescharts slanted-edge modules perform highly automated measurements of several key image quality factors using specially-designed test charts. The user never has to manually select Regions of Interest (ROIs). This page covers results that are (mostly) not derived from the slanted-edges themselves, including Noise (best in eSFR ISO) Distortion  (differing detail in different modules; best with SFRplus and eSFR ISO. Described in detail here. Tonal response*  (no noise statistics for SFRplus) Color accuracy*  when used with an SFRplus, eSFR ISO, or SFRreg center charts that contain a color pattern Vanishing resolution, aliasing, and Moiré from Wedge patterns in eSFR ISO ISO sensitivity*  (Saturation-based and […]

Rescharts Slanted-Edge Modules Part 3: Edge Results

Imatest Rescharts slanted-edge modules perform highly automated measurements of several key image quality factors using specially-designed test charts. The user does not need to manually select Regions of Interest (ROIs). This page covers results that are derived from the slanted-edges (i.e., not from grayscale, color, or wedge patterns). It also covers text output (CSV and JSON) files. Sharpness, expressed as Spatial Frequency Response (SFR), also known as the Modulation Transfer Function (MTF), can be displayed in several ways for individual edges or from the entire pattern, Lateral Chromatic Aberration Other results, not derived from slanted-edges are covered in Part 4. Noise (best […]

RAW Files

Introduction – Using RAW files – Bayer RAW and RCCC files – dcraw demosaicing – Bayer frequency units – DNG files – Rawview utility – Generalized Read Raw – Decompanding Creating Synthetic raw images   The unprocessed digital output of an image sensor is called RAW image data. In this document, we sometimes refer to RAW files from commercial cameras or development systems as Camera RAW to distinguish them from Bayer RAW files, which are standard monochrome image files that contain undemosaiced (Bayer) data. Imatest modules can analyze raw filed directly or after demosaicing. Bayer Color Filter Array (CFA)  The […]

Managing Supply Chain Image Quality with Imatest

Published January 30 2015 By Henry Koren, with contributions by Norman Koren. Edited by Matthew Donato, Jackson Roland and Ty Cumby. Table of Contents 1. Introduction The quality of imaging systems in mobile devices plays an increasingly important role in consumer purchasing decisions. A mobile device that fails to deliver acceptable quality images can have an adverse effect on the consumer’s brand loyalty, whether or not the customer has returned it. Unless proper care is taken, raising camera quality standards can reduce manufacturing yield. This could damage a supplier’s profitability as well as endanger their ability to deliver the required […]

Pre-distorted and special charts for Fisheye Lenses

SFRplus and eSFR ISO can tolerate moderate amounts of optical distortion (pincushion or barrel), but they have definite limits. In this page we describe special versions of SFRplus and eSFR ISO charts that can work with highly barrel-distorted (“fisheye“) lenses, with fields of view up to around 160 degrees— which are used in a number of applications, particularly for automotive rear-view and sports cameras. Cameras with fields of view over 160 degrees— even approaching 360 degrees— can be tested with the SFRreg module, which uses multiple individual SFRreg targets facing the camera. Pre-distorted charts should only be used with highly […]

Nyquist frequency, Aliasing, and Color Moire

Although sharpness is an important image quality factor, a sharper lens is not always better. A lens can be too sharp for a sensor, resulting in disturbing visual artifacts. These artifacts, which include “stair-stepping” and moiré patterns (low frequency patterns that can be strongly colored), can appear because of a property that digital cameras share with all digitally sampled systems— a maximum spatial frequency, called the Nyquist frequency, beyond which scene information cannot be correctly reproduced. Any information above the Nyquist frequency that reaches the sensor will be aliased to a lower spatial frequency, which can result in the artifacts described below. […]

Nonuniformity Correction in grayscale and color chart modules

Imatest can correct for nonuniform illumination and lens response (vignetting) in Imatest modules that analyze grayscale and/or color charts, including Color/Tone Setup (formerly Color/Tone Interactive), Color/Tone Auto (formerly Color/Tone Auto), Colorcheck, and Stepchart. Nonuniformity correction involves reading and specifying a second image, taken from a flat-field target (plain gray or white) under identical conditions to the test image.  Note that the correction described in this page is not the same as nonuniformity correction for slanted-edge MTF measurements. Not also that Color/Tone Interactive (a highly interactive module) and Color/Tone Auto (a batch-capable fixed version of Color/Tone Interactive) are recommended for new […]

Log Frequency

Analysis of log frequency-varying charts Introduction Log frequency, which uses the Rescharts interface, measures the contrast of narrow bar or sine charts that increase logarithmically in spatial frequency. It also measures color Moiré (Imatest Master only). When the image pattern is sinusoidal (rather than a bar chart), contrast is equivalent to SFR or MTF. This method is more direct than the slanted-edge method, but less accurate and more susceptible to noise. A chart can be created by Test Charts and printed on a high quality inkjet printer. Log Frequency image (complete and cropped) The image above used to illustrate the […]

IT-DLL Instructions

How Imatest IT/DLL works Imatest IT/DLL (Industrial Testing DLL; formerly API/DLL) is a library that allows developers to access Imatest‘s powerful image quality analysis tools via calls to functions residing in a Dynamic Link Library. At the present time (in Imatest 4.4) it supports calls from C and C++ , .NET (including C# and VB.NET), and Python.  Support for LabVIEW is under development. DLL modules perform the same calculations as the corresponding GUI-based Imatest Master modules. Fifteen modules are available: SFR   SFRplus   Star   OIS Colorcheck   Stepchart   Wedge   Random Uniformity (Light Falloff)   Distortion   eSFR ISO   SFRreg […]

Log F-Contrast

Analysis of Log Frequency-Contrast charts New in Imatest 4.0  Automatic region is available with the revised version of the chart, which includes registration marks in the corners. Sharpness and Texture Analysis using Log F‑Contrast from Imaging-Resource compares the the effects of sharpening and noise reduction in several cameras using images downloaded from Imaging-Resource.com. Introduction Log F-Contrast (short for Log Frequency-Contrast; not in Imatest Studio) measures the effects of signal processing— noise reduction and sharpening— on imaging system performance using a chart that varies in spatial frequency on the horizontal axis (log frequency increases with x) and in modulation (i.e., contrast) […]

Documentation – Previous v2020.2

View Release Notes   For beginners: We recommend these two web pages for getting started: Image Quality Factors and Using Imatest – Getting started.   Index of the Table of Contents Offline documentation Download the website for offline view (with a web browser) Image Quality  IQ factors (KPIs) measured by Imatest, with links to detailed descriptions and instructions. Sharpness  Introductions to sharpness and sharpening; comparisons of different charts; chart quality limitations & how to overcome them Other IQ factors  Noise, SNR, Temporal noise, Dynamic Range (DR),  Chromatic Aberrations, Distortion, Veiling glare, Shannon information capacity, etc. IQ Utilities  Image Processing, SSIM, […]

Some Imatest calculations up to v5.1 inappropriately averaged zeros with summary metrics

Problem Certain imatest calculations in version 5.1 and below produced zeros when the calculation was not determined. These zero values could be inappropriately averaged with summary metrics which lead to these summary metrics being underreported. The problem includes, but is not limited to the following summary metrics: Chromatic Aberration (CA) summary calculations CA_areaPCT_summary, CA_crossingPCT_summary, CA_R_G_PCT_summary, CA_B_G_PCT_summary where the individual outputs in CA_area_Pct_corner, CA_cross_Pct_corner, CA_crossing_R_G_PCT_corner, CA_crossing_B_G_PCT_corner, CA_crossing_R_G_Pxls, CA_crossing_B_G_Pxls, include zeros. MTF Summary metrics where higher frequency MTF values that are not achieved, and incorrectly reported as zero (corrected in v5.1.28) Solution Take care not to use any summary metrics where the […]

Imatest Manufacturing Equipment

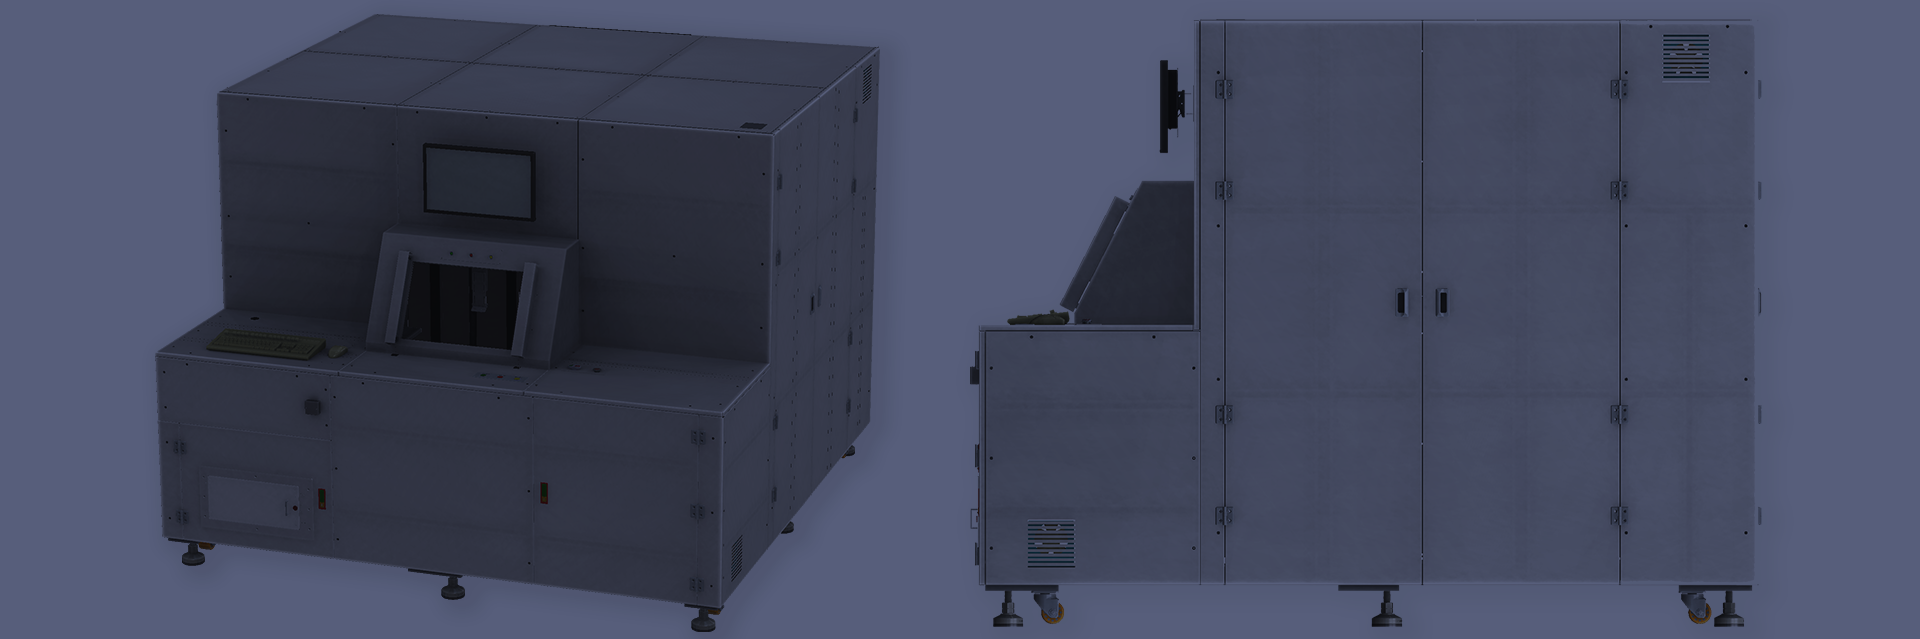
  Using the right equipment is essential to manufacturing products successfully. Automated test machines help maximize your workspace, reduce human error, and increase production speed and precision. The right test machines support best manufacturing practices that enable companies to produce high-quality imaging systems. Imatest IT on the Production Line Imatest IT integrates key module functionality with custom testing programs. With this solution, you can quickly test products on the production line to maintain quality standards. At Imatest, we make communicating data across the supply chain easier since tests and results are standardized. Imatest IT can also balance yield with image […]

Correcting Misleading Image Quality Measurements

We discuss several common image quality measurements that are often misinterpreted, so that bad images are falsely interpreted as good, and we describe how to obtain valid measurements.

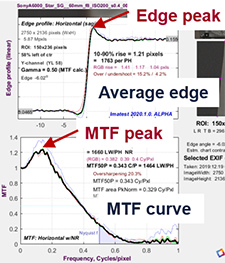
Measuring camera Shannon information capacity with a Siemens star image

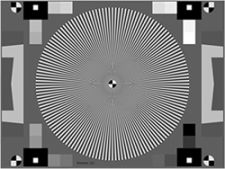
Shannon information capacity, which can be expressed as bits per pixel or megabits per image, is an excellent figure of merit for predicting camera performance for a variety of machine vision applications, including medical and automotive imaging systems.

Imatest Releases Version 2020.1

Imatest, a global image quality testing solution provider, is pleased to announce Imatest 2020.1 that adds new features on top of the major enhancements made in version 5.2. This new release further enhances the software with stability updates and regular improvements. See the Imatest Change Log for details.

Arbitrary Charts Analyses and Output

Analyses & Output – INI settings – Chart Definition Files – Chart Definition Utility   Data outputs from the Arbitrary Charts Module are different from other modules in Imatest. Only JSON files are output, no CSV or XML. The structure of the JSON is substantially different than other modules.  If many images are run in a batch, the results from all images may be contained in a single JSON. Since the Arbitrary Charts Module is based on the concept of custom layout of features, there is no fixed structure to the measurement results which it produces. Instead, the module simply produces […]

Imatest EI Presentations Now Online

The research papers presented at this year’s Electronic Imaging Symposium (EI 2020) by Imatest engineers are now available.

Legacy Change Log

The main change log is availabe for newer releases. Date Release Description Oct. 1, 2013 3.10 The new Multitest module (known briefly as ColorTest in 3.10) can analyze all the color and grayscale test charts supported by Multicharts in a fixed (i.e., non-interactive) module that can analyze chart image files in batches. It also includes most Stepchart and Colorcheck function. Five new fixed modules that can also operate in batch mode have been created from Rescharts modules: Random/Dead Leaves, Star chart, Log F-Contrast, Wedge, and Any Image Sharpness. These modules can be accessed by clicking the Modules dropdown menu in […]

Projective Camera Model

A projective camera model describes the mathematics of transforming a world point into an image point. This is done by assuming a pinhole model of a camera. Coupled with a distortion model which characterizes the deviation from the pinhole model, it is possible to model most cameras in this method*. A projective camera model only considers the relationship between world coordinates and image coordinates. It does not consider other factors such as Modulation Transfer Function (MTF), optical aberrations (e.g., chromatic aberrations, coma, etc.), linearity, and color reproduction, all of which can impact image quality. Every pixel in an image has […]