Imatest is Attending Electronic Imaging 2020

Imatest is attending Electronic Imaging 2020 in Burlingame, California on January 26-30, 2020. The symposium brings together 17 technical conferences covering all aspects of electronic imaging.

Lighting Considerations

When selecting light sources, consider ones with high uniformity to ensure accurate chart readings (refer here for the effects of non-uniform lighting on sharpness measurements). Integrated dimming capabilities can be useful when measuring imaging system quality across different levels of light to simulate multiple real-world scenes. Uniformity Uniformity measurements indicate an imaging system’s tendency to become darker the farther away from the center of the image. This occurrence is due to the radial nature of the lens which collects more light in the center and can be particularly strong with wide angle lenses. Testing for uniformity requires light sources with […]

Lighting Considerations

Uniformity      Reflective Mounting      Transmissive Chart Mounting When selecting light sources, consider ones with high uniformity to ensure accurate chart readings (refer here for the effects of non-uniform lighting on sharpness measurements). Integrated dimming capabilities can be useful when measuring imaging system quality across different levels of light to simulate multiple real-world scenes. Uniformity Uniformity measurements indicate an imaging system’s tendency to become darker the farther away from the center of the image. This occurrence is due to the radial nature of the lens which collects more light in the center and can be particularly strong with […]

Test Lab Setup

Environment Chart Mounting Test Lab Equipment Lighting Addressing Glare Lighting Uniformity Requirements Software Direct Image Acquisition   A proper testing lab setup is essential for obtaining reliable, repeatable image quality measurements. And before configuring your lab with charts and equipment, consider the following: Field of View (FOV) Considerations Test Chart Considerations Lighting Considerations Note: If you are photographer, student, and artist using Imatest Studio user, please refer to our Photography lab setup guide for relevant information. Environment To obtain precise measurements, your test lab should be set up in a space with little ambient lighting such as an interior, windowless room. […]

ISO 12233 eSFR Charts for Imatest LED Light Sources

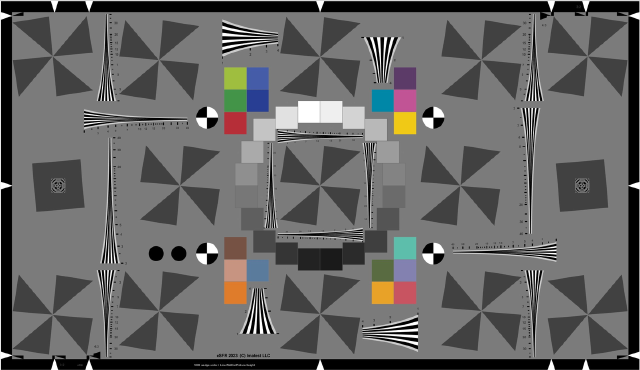
The ISO12233:2017 eSFR Test Charts listed here are Pre-Mounted for use with Imatest LED Light Sources. This chart is designed to work with the eSFR ISO Module. Imatest 

ISO 12233:2017 eSFR Test Charts are implementations of the Low Contrast Edge SFR (eSFR) test chart illustrated in Section 6.1 and Annex C of the ISO Standard DocumentThe chart is available in two general versions:

  • Enhanced: extra squares, wedges, and color patterns when printed with technologies that allow color
  • Extended: similar to Enhanced, but with a 16:9 aspect ratio, suitable for HDTV and cinema (Note: Works with Matlab esfrChart)

Download PDF Info Sheet

Lead Time: 3 Weeks

Spilled Coins Charts for Imatest LED Light Sources

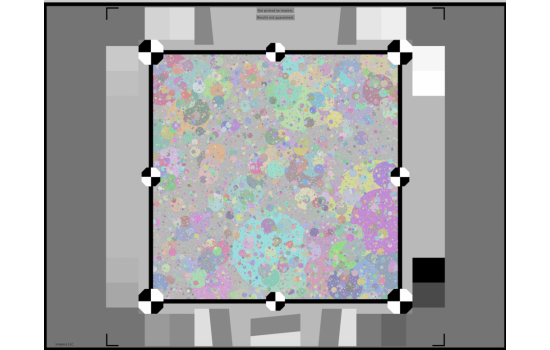
The Imatest Spilled Coins chart is designed to measure texture sharpness. It has offers nearly perfect scale-invariance, which improves the accuracy and robustness of measurements, as well as gray regions to the left and right of the chart that facilitate noise removal.

The Imatest Spilled Coins Cross test chart uses cross-correlation calculation texture metrics to provide improved stability for images with nonlinear noise reduction. Users can now more accurately differentiate between noise and texture. Random/Dead Leaves Cross, which runs under the interactive Rescharts interface, measures SFR (Spatial Frequency Response) or MTF (Modulation Transfer Function) from these patterns

Learn more about the Spilled Coins Pattern and it’s use through the Rescharts Module

Lead Time: 3 Weeks

SFRplus Charts for Imatest LED Light Sources

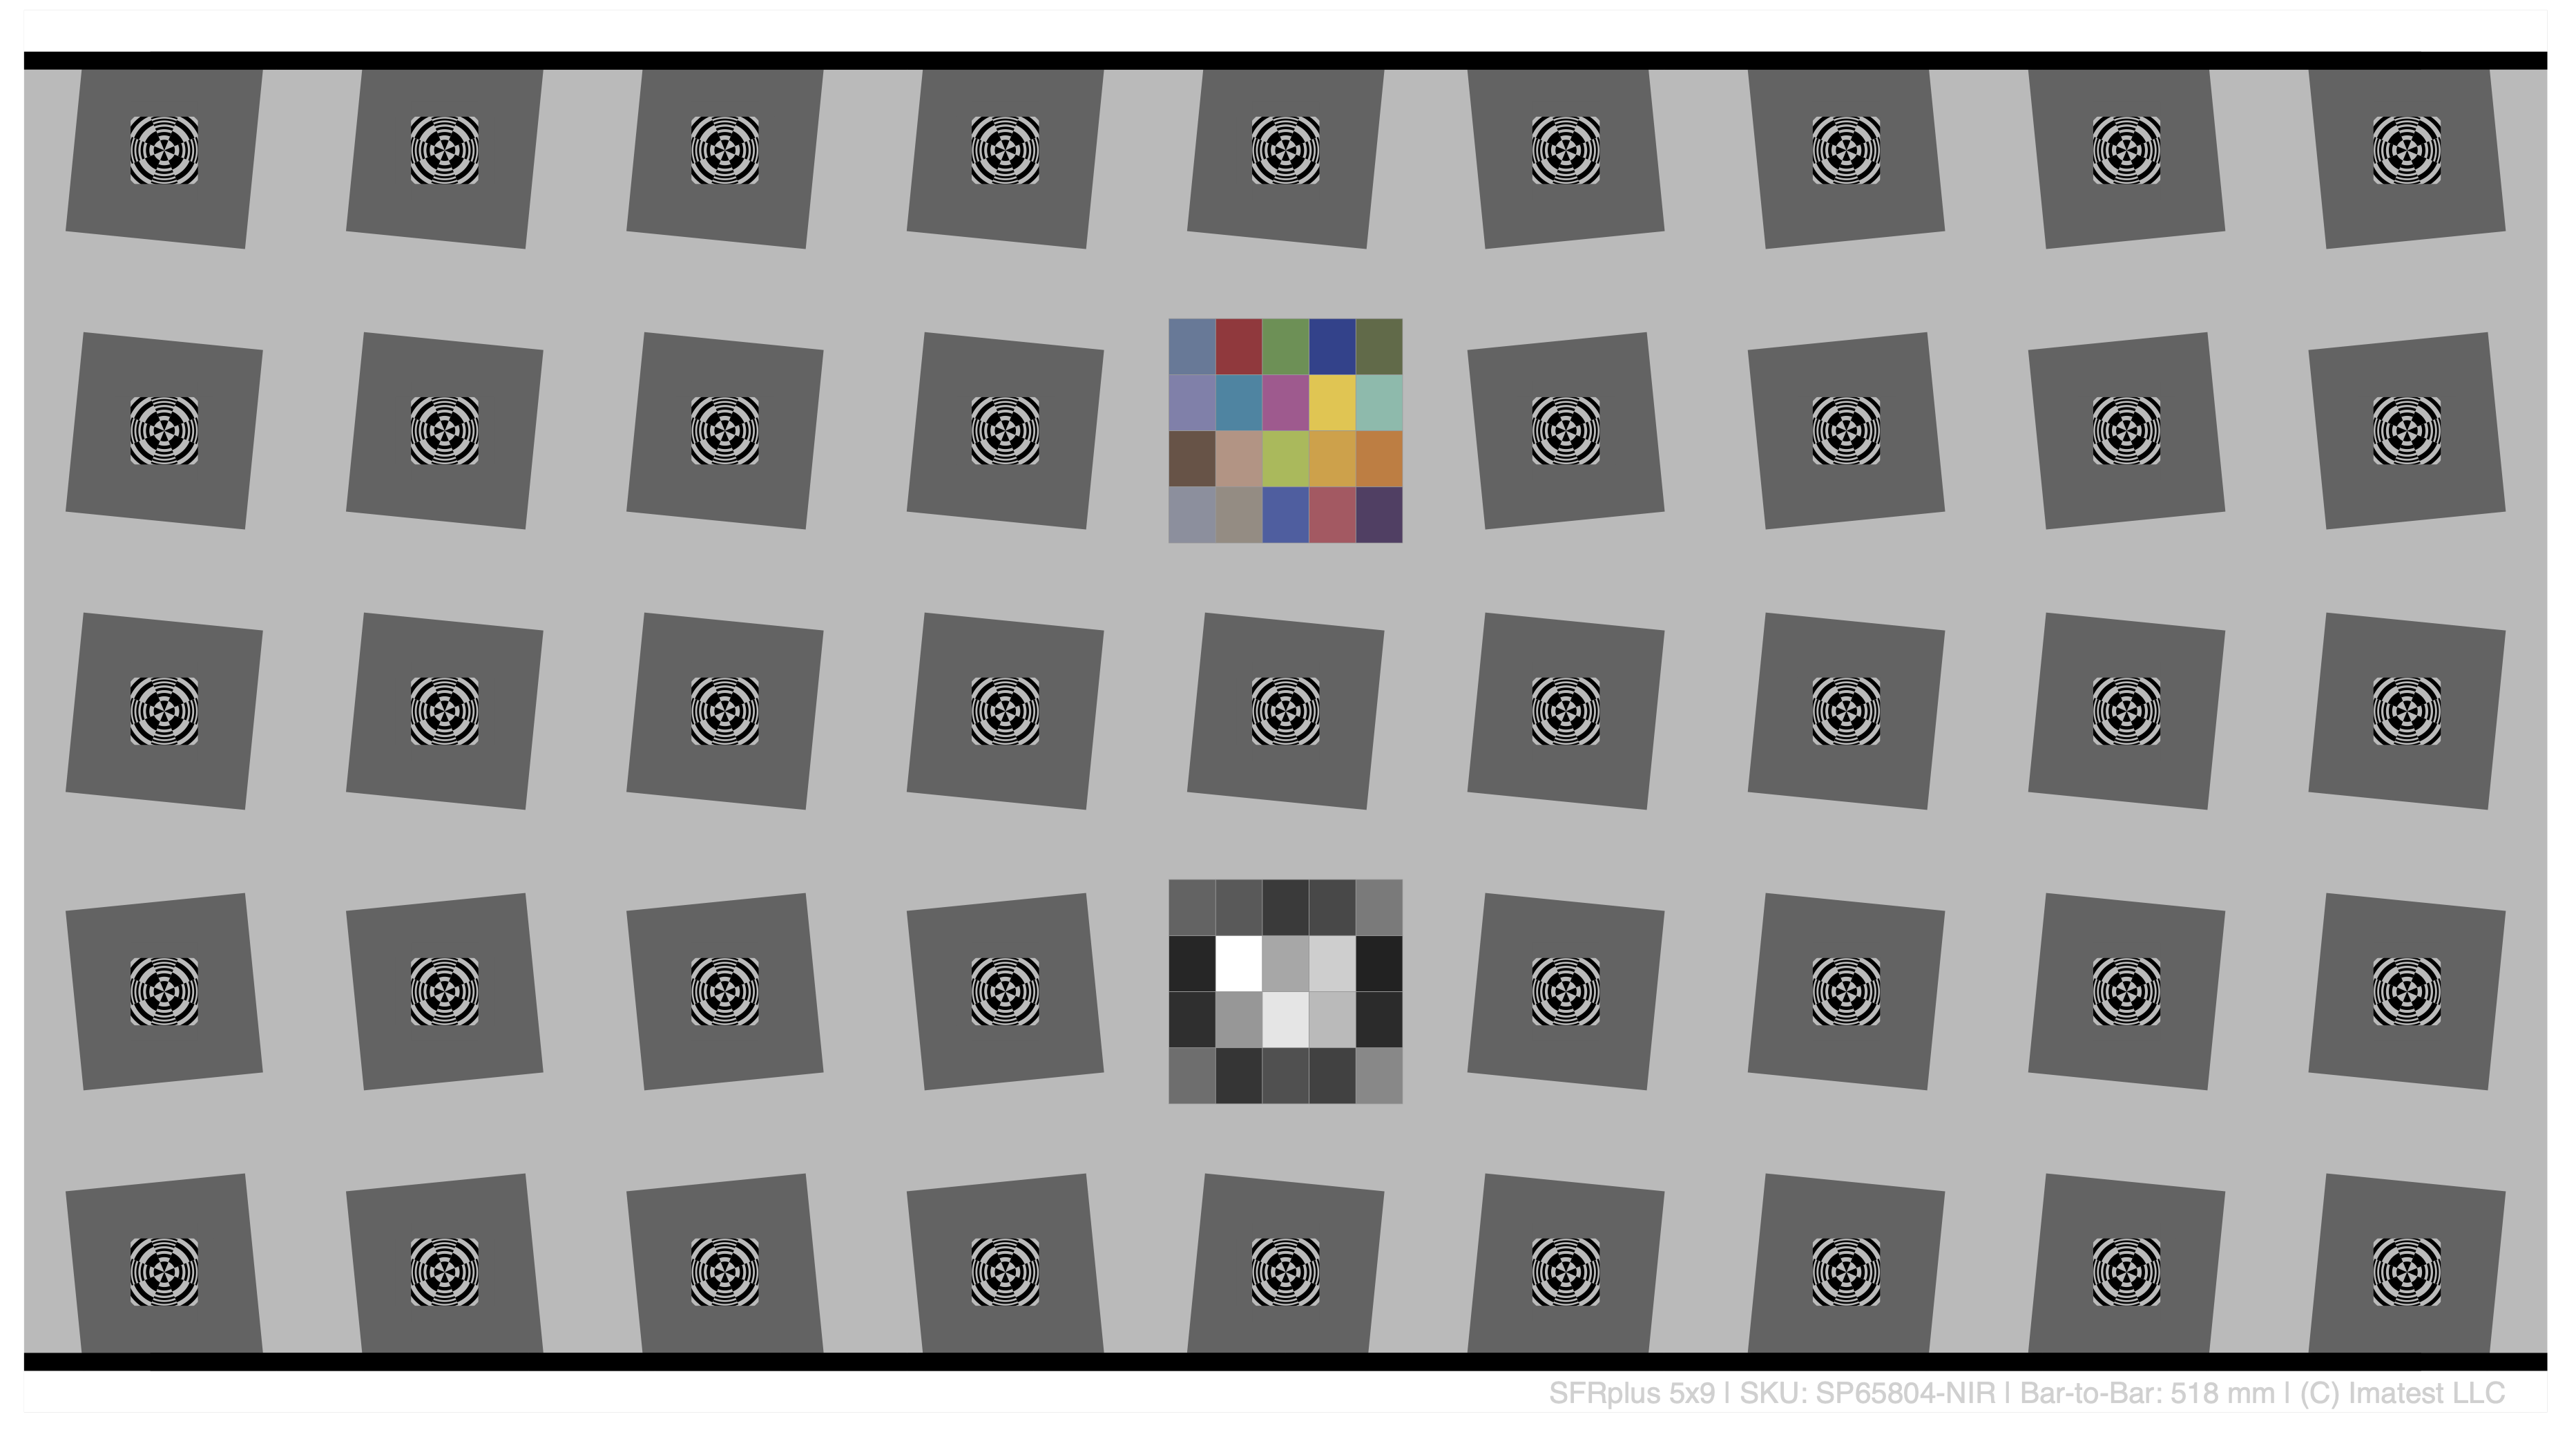
The SFRplus Test Charts are available Pre-Mounted for use with Imatest LED Light Sources. This test chart can be used with the SFRplus Module in Imatest to measure MTF, lateral chromatic aberration, distortion, tonal response, and color accuracy, and offers full support for automated image quality testing. Learn more about the SFRplus Module

Download PDF Info Sheet

Lead Time: 3 Weeks

Photography Lab Setup

Test charts Lighting Glare-free, uniform illumination of your test chart is ideal for Imatest software to accurately measure the image quality of your camera. This can be achieved using reflective or transmissive light sources. Reflective inkjet chart lighting Widely available LED shop lights provide an excellent solution for Imatest Studio customers whose primary interest is testing camera and lens sharpness. Little assembly is required with the exception of the need to mount them. You may need more than one type of light because they typically have just one color temperature (e.g. 4000K) and have a relatively low Color Rendering Indices (around […]

Checkerboard Charts for Imatest LED Light Sources

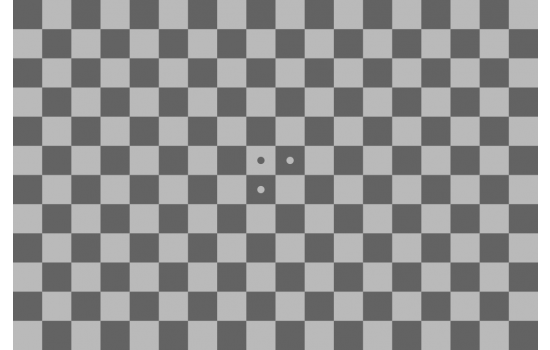
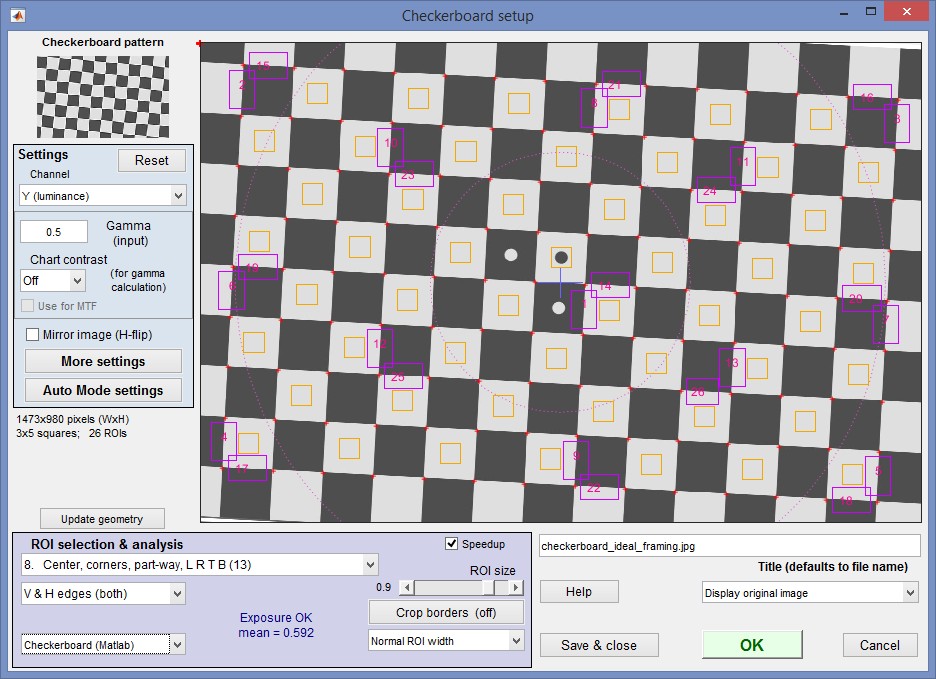
The Checkerboard Test Charts are available Pre-Mounted for use with Imatest LED Light Sources. This chart is designed to work with the Checkerboard module. This module enhances testing of varying distances by supplying more testable regions to provide automated measurements of sharpness, lateral chromatic aberration, and distortion from images.

Learn more about the Checkerboard Module.  Please note that this module runs slower than eSFR ISO and SFRplus modules and is less tolerant to extreme amounts of defocus or blooming degradations.

Download PDF Info Sheet

Lead Time: 3 Weeks

Which Imatest Charts Support Automatic Detection?

Using testing charts (also known as targets) improves the efficiency and repeatability of your testing workflow. Imatest offers several charts that support automatic detection as well as charts with registration marks.

Imatest 5.2 Release Notes

New Features and Enhancements ON Semiconductor DevwareX support for this advanced image sensor interface software, which replaces Devware. Support for the APbase image acquisition API. Decompanding for the proper processing of piecewise linear (PWL) companded RAW files, which can extend sensor dynamic range by allowing different tonal curves for ranges of digital output values. Contrast Detection Probability (CDP) from Contrast Resolution chart using low-contrast path triplets to calculate the draft IEEE P2020 metric. CDP is a metric for the distinguishability from two input light levels through an imaging system. Improved Color/Tone Module Interfaces – Chart selection is clearer and more […]

Nonuniformity Correction in grayscale and color chart modules

Imatest can correct for nonuniform illumination and lens response (vignetting) in Imatest modules that analyze grayscale and/or color charts, including Color/Tone Setup (formerly Multicharts), Color/Tone Auto (formerly Multitest), Colorcheck, and Stepchart. Nonuniformity correction involves reading and specifying a second image, taken from a flat-field target (plain gray or white) under identical conditions to the test image.  Note that the correction described in this page is not the same as nonuniformity correction for slanted-edge MTF measurements. Not also that Multicharts (a highly interactive module) and Multitest (a batch-capable fixed version of Multicharts) are recommended for new work. Colorcheck and Stepchart are […]

Contrast Resolution chart and analysis

Introduction Introduction – Background – The Contrast Resolution chart – Photographing & analyzing – Tonal response and SNR – Visualization – Analysis – Contrast Resolution Dynamic Range – Tone mapped results – Summary – Verification This page describes the Imatest Contrast Resolution chart and analysis (supported by Imatest 5.0+), which is designed to measure the visibility of low contrast objects in larger fields over a wide range of brightness. These measurements are expressed as the Contrast Resolution Signal-to-Noise Ratio (SNRCR) and Dynamic Range (DRCR). They are of particular interest to the automotive and security industries. This method of dynamic range measurement was inspired […]

Using Stepchart

Photographing the chart – Running Stepchart – Settings – Output – Temporal noise Auto-exposure – Saving – Dynamic range (DR) – DR definitions – Algorithm   Stepchart measures the tonal response, noise, dynamic range, and ISO sensitivity of digital cameras and scanners using Reflective grayscale step charts such as the Kodak/Tiffen Q-13 and Q-14 Gray Scales, which have a single row of patches (a linear arrangement), or charts such as the ISO-14524 or ISO-15739 charts, with non-linear (multiple rows; may be circular) patch arrangements, shown below, or Transmissive (backlit) grayscale step charts such as the Imatest 36-patch Dynamic Range or 36-patch […]

Grayscale charts for Color/Tone and Stepchart

In addition to linear step charts (which have a single row of patches), three Imatest modules— Stepchart, Color/Tone Setup (formerly Multicharts), and Color/Tone Auto (formerly Multitest)— can analyze the tonal response and noise of a number of additional multi-row grayscale charts (reflective and transmissive), most of which are available from the Imatest Store. With most of these charts you can choose between default reference values and a custom reference file that you can measure, or (for 26-patch Dynamic Range charts) are supplied by Imatest. The recommended charts on this page are the 36-patch Dynamic range, ISO-14524, ISO-15739, and 20-patch circular […]

Using Blemish Detect

Measure visible sensor defects Blemish Detect detects visible sensor defects (typically blurred (dark) spots caused by dust in front of the image sensor, but light blemishes can also be detected). To ensure that only visible blemishes are flagged— and blemishes below the threshold of visibility are not— the image is filtered by a response function derived from the Human Visual System (HVS). Filter settings are adjustable for a wide range of applications and viewing conditions. Blemish detect also includes all important functions of Uniformity. The IT version of Blemish Detect, which can be incorporated into automated testing systems, can significantly […]

Glosario en Espanol

Imatest Glosario Par Pablo Ruiz Garcia Aliasing. Elementos de baja frecuencia, a veces muy molestos, que aparecen cuando la energía de la señal alcanza al sensor digital por encima de la frecuencia Nyquist. El efecto de flecos moire son un tipo de alilasing. Aberración cromática. Es una característica de la lente que provoca que las distintas longitudes de onda formen foco en distintos puntos. Existen dos tipos; longitudinal, donde los diferentes colores forman su foco en planos distintos. Y, lateral, donde la longitud focal de la lente, por lo tanto la ampliación, es diferente para cada color. La aberración cromática […]

Glossary

Spanish language translation: Glosario en Espanol Aliasing Low frequency artifacts, sometimes quite disturbing, that appear when the image sensor receives significant signal energy above the Nyquist frequency. Color aliasing in Bayer sensors can be particularly troublesome. “Moire fringing” is a type of aliasing. See diagram in Nyquist frequency, below. Controlled by means of Anti-Aliasing (Optical Lowpass) Filters, which blur the image slightly (a classic tradeoff).  Aperture   The circular opening at the center of a lens that admits light. Generally specified by the f-stop (f-number), which is the focal length divided by the aperture diameter. A large aperture corresponds to […]

Cross-reference tables

Tables to help you navigate Imatest modules and charts Imatest is a complex, rich application involving a great many image quality factors, modules, and test charts. The tables below, for Quality Factor, Module, and Test chart are designed to help navigate the site. A Table of contents is also available. Suppliers Most test charts are available from the Imatest Store. Supplier Chart(s) and comments Location Imatest A large variety of charts (sharpness, color, tone, dynamic range) may be ordered from the Imatest store. Boulder, CO USA Stouffer The Stouffer T4110 transmission step wedge was recommended for single-image Dynamic Range measurements […]

Implementing Pass/Fail in Imatest

Imatest Pass/Fail Operation and Reference Introduction Blemish and Uniformity settings | SFRplus settings Imatest can return pass/fail (P/F) results for industrial inspection or for any tests where pass/fail results are required. Although pass/fail is primarily intended for IT (DLL and EXE), it works with GUI-based versions of Imatest (except for Studio), where it can be particularly useful for testing P/F thresholds for Imatest IT. Starting with Imatest 4.0, the Pass/Fail monitor lets you examine P/F results in detail. Summary Pass/fail settings— minima, maxima, or limits— are stored in their own ini file (separate from the standard ini file: imatest.ini or […]