Search Results for: MTF
Compensating MTF Measurements for Chart Quality Limitations
Camera MTF (sharpness) measurements are subject to a number of variations, some of which, like noise, are random and difficult to control, and some of which are systematic and can be corrected. Variations caused by limitations in chart sharpness are in the latter category. These variations are also affected by the Field of View (FoV) of the image used to test the camera, which is closely related to chart size for charts designed to fill the camera frame. For a given print technology, increasing the FoV, which typically means increasing the spacing between the chart and camera, will increase the […]
Correcting nonuniformity in slanted-edge MTF measurements
Slanted-edge regions can often have non-uniformity across them. This could be caused by uneven illumination, lens falloff, and photoresponse nonuniformity (PRNU) of the sensor. Uncorrected nonuniformity in a slanted-edge region of interest can lead to an irregularity in MTF at low spatial frequencies. This disrupts the low-frequency reference which used to normalize the MTF curve. If the direction of the nonuniformity goes against the slanted edge transition from light to dark, MTF increases. If the nonuniformity goes in the same direction as the transition from light to dark, MTF decreases. To demonstrate this effect, we start with a simulated uniform slanted […]
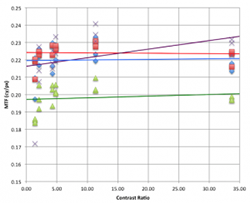
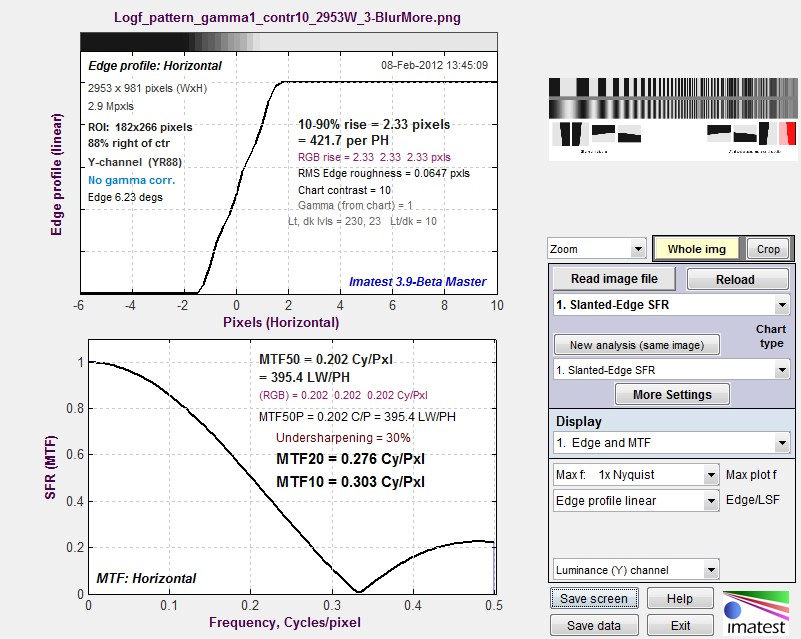
High-contrast edge-SFR test targets produce invalid MTF results

The obsolete ISO 12233:2000 standard defines a resolution test target with a high contrast ratio. These are typically produced at the maximum dynamic range of a printer, which can be anywhere from 40:1 to 80:1. The high contrast can lead to clipping of the signal which leads to overstated invalid MTF values.
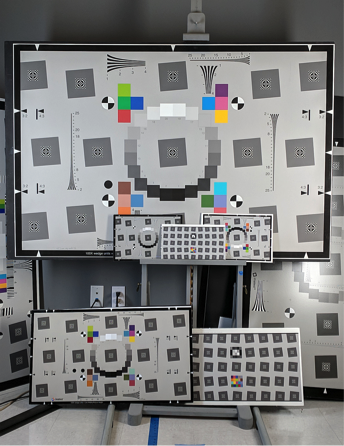
Measuring MTF with wedges: pitfalls and best practices
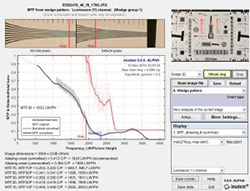
This paper was given as part of the Electronic Imaging 2017 Autonomous Vehicles and Machine session. When: Monday, January 30, 2017, at 10:10 am By: Norman Koren with support from Henry Koren, Robert Sumner
Gamma, Chart Contrast and MTF Calculations
A fuller and more up-to-date explanation of gamma, including how to obtain it for slanted-edge MTF calculations can be found on Gamma, Tonal Response Curve, and related concepts. Gamma (the average slope of log pixel levels as a function of log exposure for light through dark gray tones) is used, per the ISO 12233 standard, to linearize the input data, i.e., to remove the gamma encoding applied by the camera or RAW converter. Gamma defaults to 0.5 = 1/2, which is typical of digital cameras, but may be affected by camera or RAW converter settings. Imatest Settings For accurate calculation of edge-SFR from using […]
Infrared Targets, Correction for Slanted-Edge MTF Measurements
Infrared Targets Standard Imatest inkjet-printed test charts produced prior to February 2016 work in Near InfraRed (NIR) wavelengths out to approximately 1 micron. In February 2016 we upgraded our printers and found (to our disappointment) that our new printers do not have the same reflective densities for NIR wavelengths as for visible wavelengths. We are working out solutions to this issue. Please contact us if your needs include NIR.
Measuring Multiburst pattern MTF with Stepchart

Measuring MTF is not a typical application for Stepchart— certainly not its primary function— but it can be useful with multiburst patterns, which are a legacy from analog imaging that occasionally appear in the digital world. The multiburst pattern is not one of Imatest’s preferred methods for measuring MTF: see the MTF Measurement Matrix for a concise list. But sometimes customers need to analyze them. This feature is available starting with Imatest 4.1.3 (March 2015).
LSF correction factor for slanted-edge MTF measurements
A correction factor for the slanted-edge MTF (Edge SFR; E-SFR) calculations in SFR, SFRplus, eSFR ISO, SFRreg, and Checkerboard was added to Imatest in 2015. This correction factor is included in the ISO 12233:2014 and 2017 standards, but is not in the older ISO 12233:2000 standard. Because it corrects for an MTF loss caused by the numerical calculation of the Line Spread Function (LSF) from the Edge Spread Function (ESF), we call it the LSF correction factor.
A Study of Slanted-Edge MTF Stability and Repeatability
by Jackson K.M. Roland Abstract The slanted-edge method of measuring the spatial frequency response (SFR) as an approximation of the modulation transfer function (MTF) has become a well known and widely
Using Test Charts
Create test chart files for high quality inkjet prints for for screen display Imatest 24.2 (pilot program): Test charts can now create high quality screen displays. Although we strongly recommend that customers purchase charts from the Imatest Store, the Imatest Test Charts module allows you to create test chart files for printing on high quality photographic inkjet printers. If you plan to print charts using this module, you should be skilled at fine printing and have a knowledge of color management to obtain optimum chart quality; otherwise we recommend purchasing charts at the Imatest Store. Introduction – Screen display […]
Using direct image acquisition
Direct image acquisition allows images to be captured directly from a variety of devices without first being stored as files. It has several important applications. Introduction – Direct data reload for realtime analysis – Signal averaging By continuously reloading images, it can be used for realtime (or near-realtime) image analysis, where “realtime” means that analysis appears to be instant in the timeframe of human perception. It is especially valuable for focusing with slanted-edges (which can be analyzed faster than other MTF patterns) or with cropped areas of arbitrary images. It is very useful for signal averaging — a technique […]
Validating the Imatest slanted-edge calculation
Introduction Imatest’s slanted-edge algorithms for calculating MTF/SFR are based on ISO 12233 standard, “Photography – Electronic still picture cameras – Resolution measurements”. Although this standard is well-established in industry, we often receive questions regarding its validity. This document describes methods for validating the Imatest slanted-edge method for calculating image sharpness (expressed as Modulation Transfer Function, MTF, which is synonymous in practice with Spatial Frequency Response, SFR). MTF is a measurement of image contrast as a function of spatial frequency. As such, it is a measure of device or system sharpness, which is only indirectly related to perceived image sharpness in […]
Using Stepchart
Photographing the chart – Running Stepchart – Settings – Output – Temporal noise Auto-exposure – Saving – Dynamic range (DR) – DR definitions – Algorithm Stepchart measures the tonal response, noise, dynamic range, and ISO sensitivity of digital cameras and scanners using Reflective grayscale step charts such as the Kodak Q-13 and Q-14 Gray Scales, which have a single row of patches (a linear arrangement), or charts such as the ISO-14524 or ISO-15739 charts, with non-linear (multiple rows; may be circular) patch arrangements, shown below, or Transmissive (backlit) grayscale step charts such as the Imatest 36-patch Dynamic Range or 36-patch […]
Image Processing for Image Information Metrics
The basic premise of this work is that Information capacity is a superior metric for predicting the performance of imaging systems. It is better than sharpness or noise, which it incorporates, and it can be used to derive metrics for measuring object and edge detection performance and for designing electronic filters that optimize system performance. Related pages Image Information Metrics: Information Capacity and more contains key links to documentation, white papers, news, and more on image information metrics. The paper from Electronic Imaging 2024, Image information metrics from slanted edges, contains the most complete exposition of the image information metrics. […]